Let us know what type of content you'd like to see more of. Fill out our three question survey.
Studying River Health through Citizen Science and Data Analysis in Maryland
This post is one of a series of posts on Data Management.
Nov 21, 2019
Since 1970, DAI has worked in 160 countries on development issues ranging from good governance to environmental problems. But what about scientific policy-oriented initiatives in our backyard? With a headquarters in Bethesda, Maryland, DAI is surrounded by a vibrant and diverse social and ecological community, and civil society organizations that focus on sustainable development. At the Center for Digital Acceleration (CDA), we’ve had the good fortune of engaging two such organizations— Spa Creek Conservancy (SCC) and the Environmental Center at Anne Arundel Community College (AACC)—that combine formal academic research with citizen science and use data to bring awareness to the health of the Chesapeake Bay watershed.
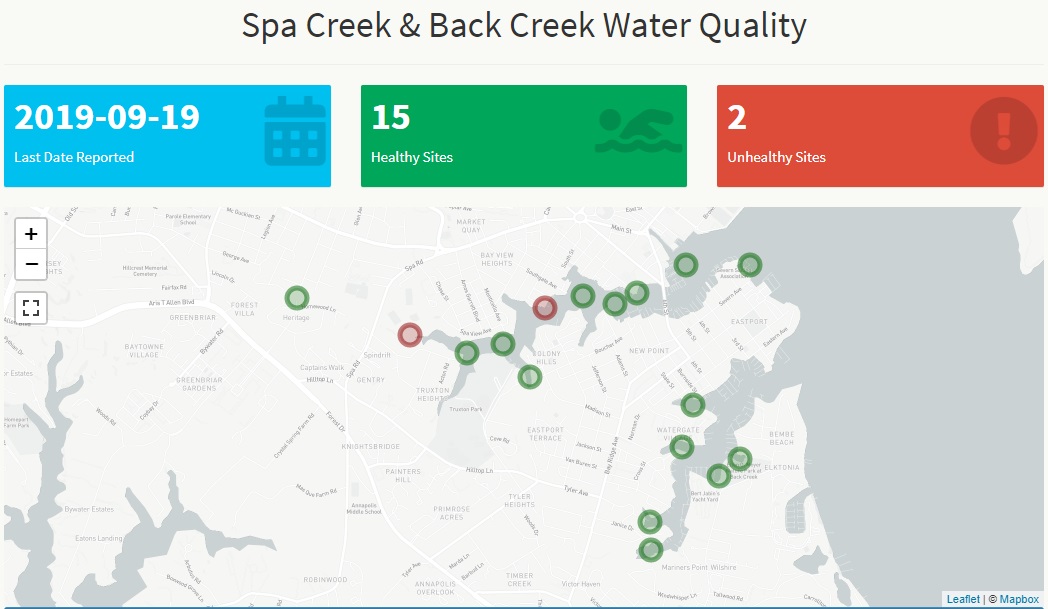
Water testing locations and test results in Spa and Back Creek.
Facing Growing Threats
One of many organizations dedicated to Maryland rivers, SCC supports a variety of advocacy, education, and research initiatives for the Spa Creek watershed, a section of creek that spans historic downtown Annapolis, Eastport, and the surrounding area. Spa Creek provides recreational opportunities for thousands of boaters, fishermen, and sightseers each year. And with development in the region booming, it, like many coastal regions, face growing threats to the local ecosystem.
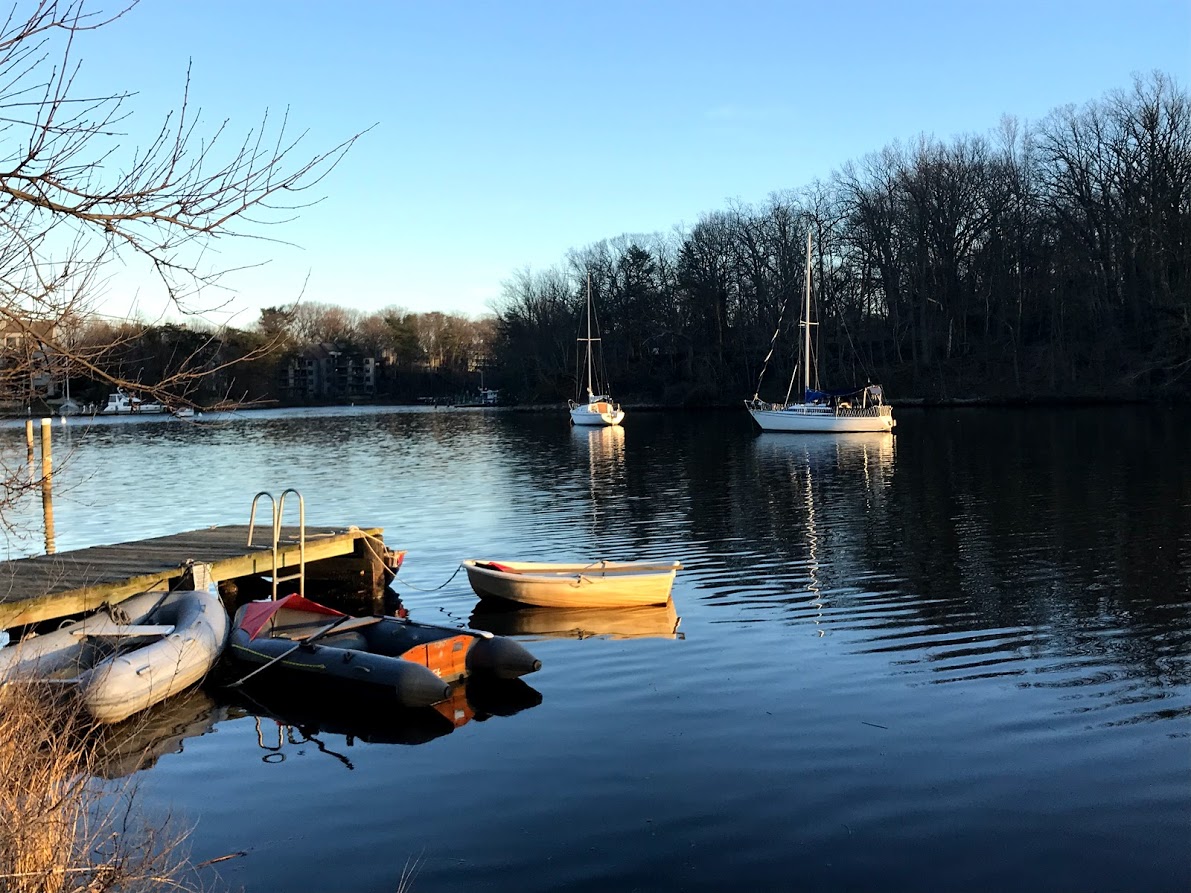
Boats on Spa Creek.
According to SCC water monitoring Director Donna Jefferson, the organization was founded in large part because “the Environmental Protection Agency declared Spa Creek a highly impaired urban watershed. Spa Creek Conservancy was founded to restore it— make it fishable and swimmable.” As an organization, its goals are to clean up the creek from the headwaters to Severn River, educate residents about the link between human lifestyles and the health of the watershed, reduce pollution, and identify sources of damage to the watershed through data collection and research. To accomplish this, SCC works with AACC’s Environmental Center, which, since 1980, has conducted research designed to address local environmental issues. Led by Dr. Tammy Domanski, the Center consults with conservation organizations about their goals, provides laboratory water testing services, equipment, and training to volunteer networks. In the case of SCC, one of its interests is in using data to tell the story of the environment, and hopefully to get city and county planners to take data into consideration with thinking about permits for buildings and other construction projects. So how is all of this data managed?
Weekly Data Collection
Because this data is based on the collection of physical samples, SCC coordinates a network of volunteers who visit 17 sites weekly. Samples are sent to the AACC lab for testing and analyzed by Domanski and her team for accuracy and outliers. Data analysis focuses on Enterococci and other parameters including clarity, dissolved oxygen, salinity, pH, and nutrient levels.
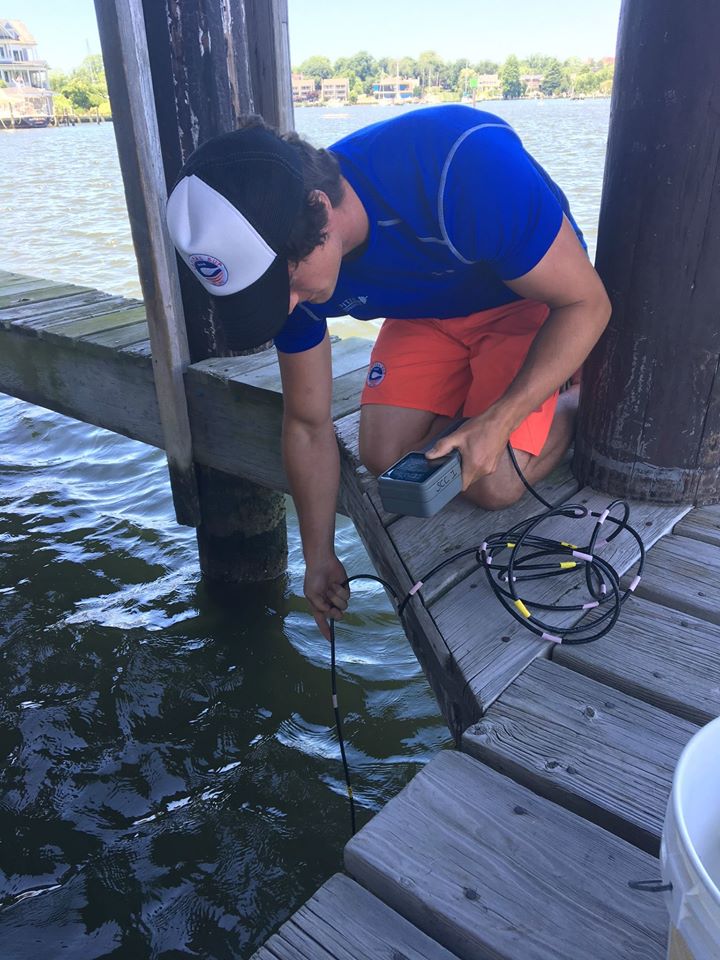
A volunteer collects water samples for testing.
I asked Domanski about the role of the citizen scientist, and she highlighted a shift in the perception of volunteer networks, noting that “trained volunteers can generate data that is just as precise and accurate as paid technicians.” She also noted the proliferation of websites dedicated to information sharing and environmental advocacy. “These data points are useful and significant,” she said. “Historically, there were not enough places to put data that were open to the public. Now, there are a large number of advertised ways to visualize data.” So how do organizations like SCC and AACC manage their data, and what are their challenges?
Analysis for Multiple Audiences
Like many organizations, SCC and its regional counterparts use a combination of paper and electronic tools to share data and have created a spreadsheet-based data management system. But according to Domanski, the process with technology hasn’t always been encouraging, especially when thinking across data collection efforts and regions. “We spend so much time trying to compare systems that have a number of redundancies. We know there are gaps in the information we are putting out there. But we spend so much time looking at redundant layers of information. It’s hard to even know what we’re missing.”
This summer, our team connected with SCC and AACC to support their growing amount of data and desire for more robust analysis. Taking a human-centered approach to the problem, we developed an analytical platform that integrates with their existing database, and provides geographic, temporal, and regression analysis. Digging into the tech for a moment—the current version of the analytical platform is built using in R using the R/Shiny web framework. The website pulls data from a Googlesheet managed by Domanski, and uses ggplot and leaflet to build a series of interactive data products. To learn more about using Googlesheets with R, check out a previous post introducing R and RStudio for data analysis.
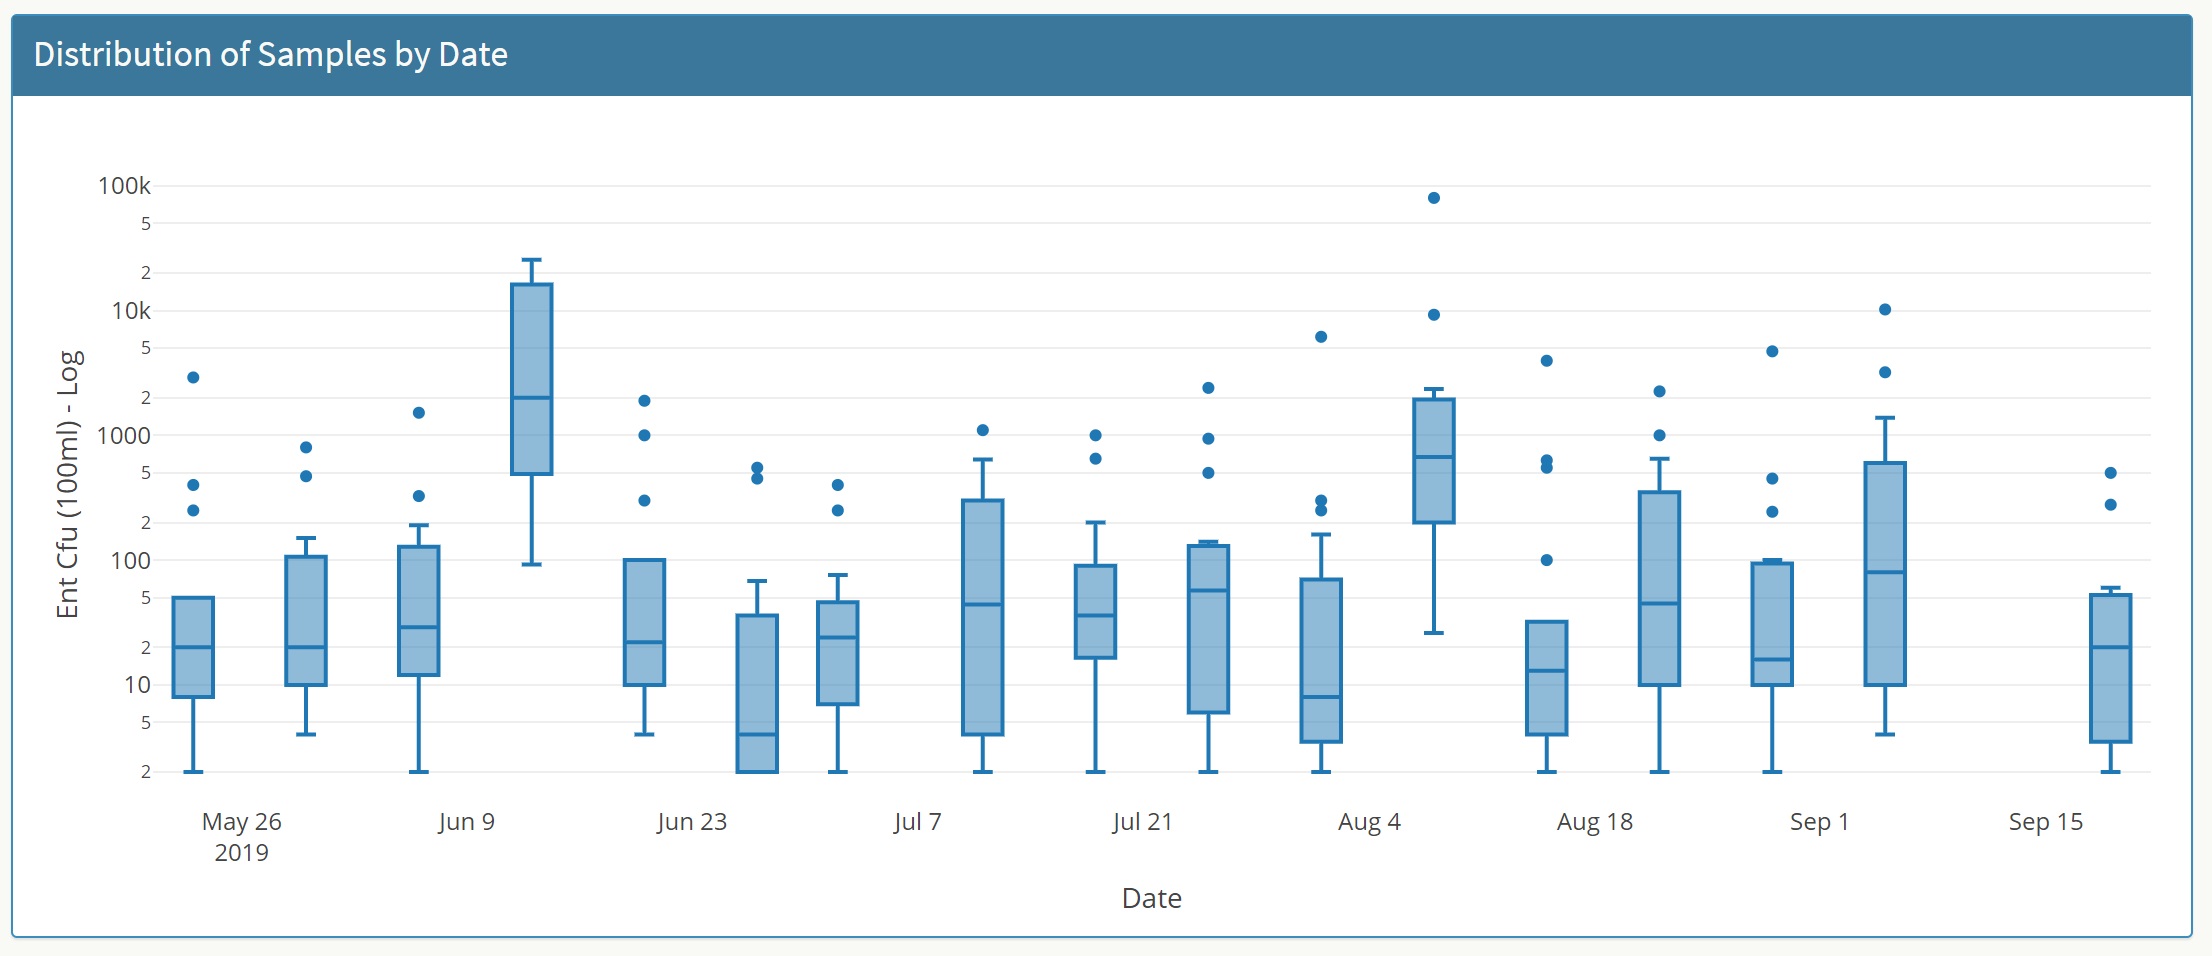
Distribution of test results over time.
Tying Data to Awareness and Policy
Once data is uploaded and analyzed via the web platform, analytical products are used to rapidly communicate water safety to community members via social media. But beyond weekly updates, this data is used to understand trends and drivers of water health. After just a summer of data collection, we are able to see which sites experience the most variability in water health, which areas are most consistently unhealthy, and can investigate the correlation between rainfall and water health. Preliminary results show a statistically significant correlation between rainfall and bacteria levels. While this type of statistical analysis is expected of the scientific community, our team worked to create data analysis efficiencies that enable organizations like Spa Creek to move from data collection to analytical product as quickly as possible.
The data has also been used to track the potential effectiveness of restoration initiatives in the area. For example, construction for the Hawkins Cover Ravine Restoration Project commenced in early 2018 and included efforts to control sediment and water flow through infrastructure changes. Thanks to multiple years of water testing, SCC and AACC could see a reduction in bacteria levels post construction. SCC’s Donna Jefferson noted that, “having baseline data enabled us to see the area changes over time.”
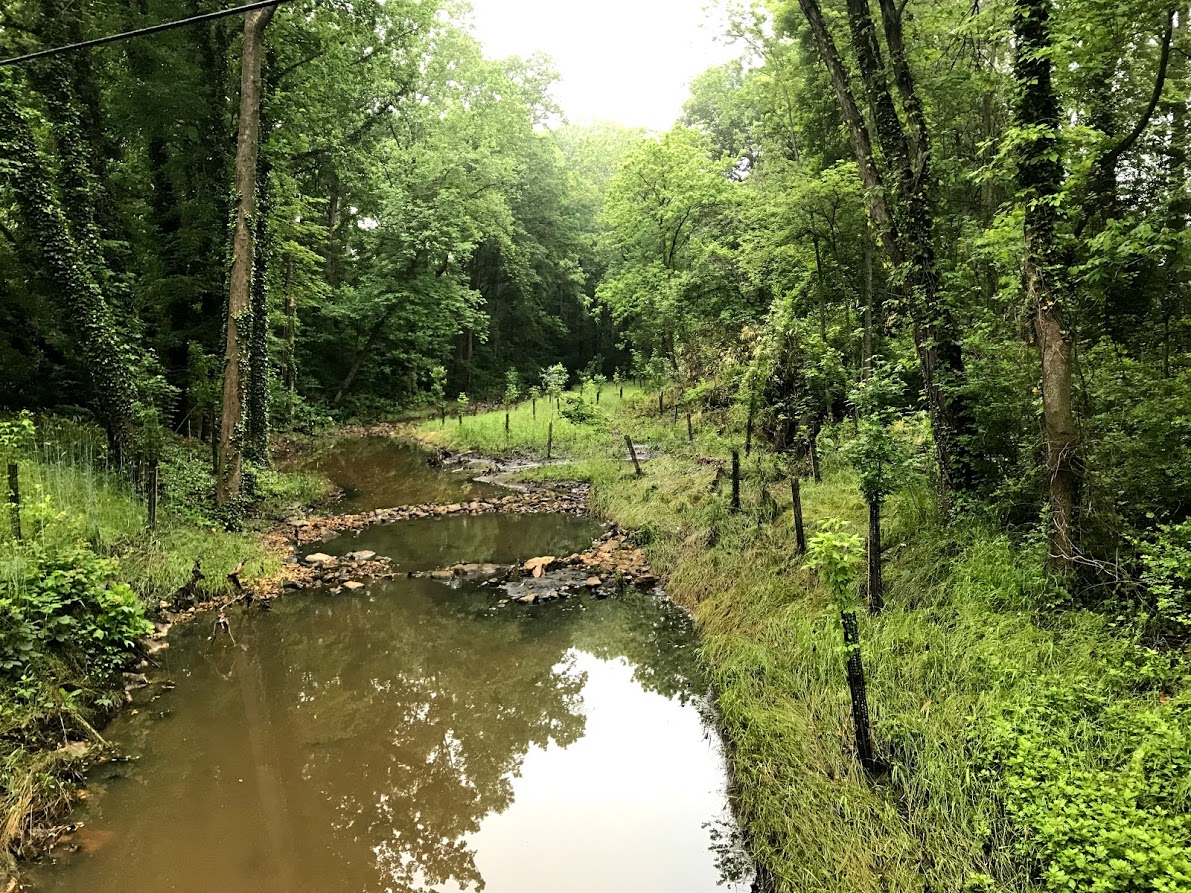
Headwater restoration area.
Planning for Next Summer
Data collection for 2019 concluded in September, giving Domanski the task of writing an annual report. This moment is also an opportunity for the consortium of river conservation associations to convene and consider ways to analyze data across the region. While each individual organization has its own means of collecting and analyzing data, SCC and AACC are interested in improving coordination across the community of associations. Oh, and you can take a look at the data analysis here. Stay tuned for collection in 2020!