Let us know what type of content you'd like to see more of. Fill out our three question survey.
COVID-19 Data Analysis, Part 4: Forecasting Hospital Capacity in Mexico
This post is one of a series of posts on COVID-19 Data.
May 1, 2020
This post was written by DAI Data Scientist Jamie Parr, with contributions from Greg Maly, Gratiana Fu, Eduardo González-Pier, Susan Scribner, and Kirsten Weeks. This analysis is Part 4 of a series on known risk factors associated with COVID-19, with a specific focus on Mexico. It is the first of several posts that will provide an analytical overview of different aspects of COVID-19 in Mexico. The analysis will be updated as we receive additional data and the code for all related analysis will be made available shortly.
One of the most important determinants of death rates in a pandemic is hospital capacity rates. The principal reason public health officials have spoken so much about “flattening the curve” is due to the need to reduce hospital burden: when a city, state, or country has a large spike in cases over a short period of time, hospitals will get inundated with moderate to severe cases to the point where doctors must make choices on who receives care. This is the current reality in New York and the tail end of what has transpired in the current wave of cases of Italy and Spain, among other European countries.
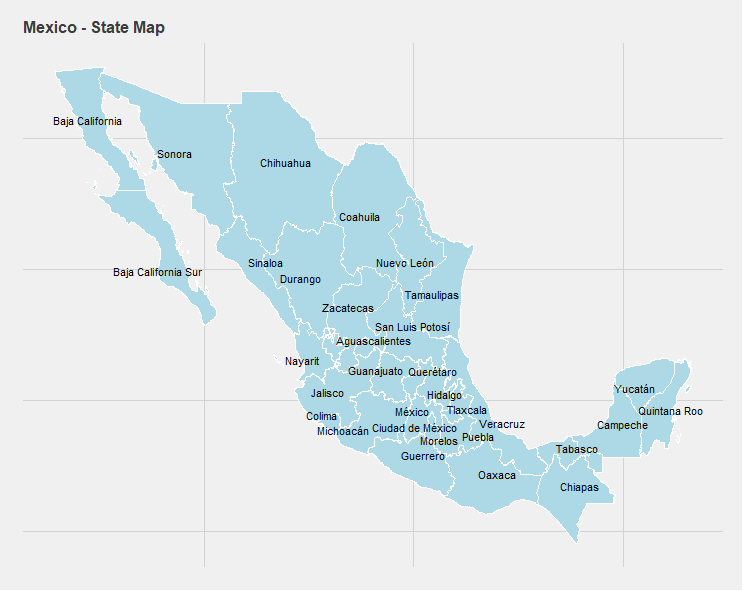
While focus has largely been on these hotspots, large middle-income countries such as Brazil, Mexico, and South Africa have recently suffered a surge in cases. In particular, DAI’s presence in Mexico with the Better Health programme funded by the U.K. Foreign and Commonwealth Office leads us to ask what health care resources the country has at its disposal. Our national-level population risk index suggests that Mexico has a medium level of risk, which makes it an interesting case study for other countries at this level. In this post, we evaluate hospital capacity in Mexico by providing scenario forecasts on bed availability at the subnational level. First, we provide a brief overview of the Mexican health system and the hospital resources available. Second, we examine hospital capacity forecasting scenarios at the state level based upon the Harvard Global Public Health Institute’s estimates for regions of the United States. In doing so, we estimate a first set of scenarios of hospital occupancy rates using only public hospital resources, and then a second set of scenarios that includes the resources of the private hospital network. Finally, we conclude with some insights and implications of these forecasts.
Brief Overview of Mexico’s Health System and Hospital Beds
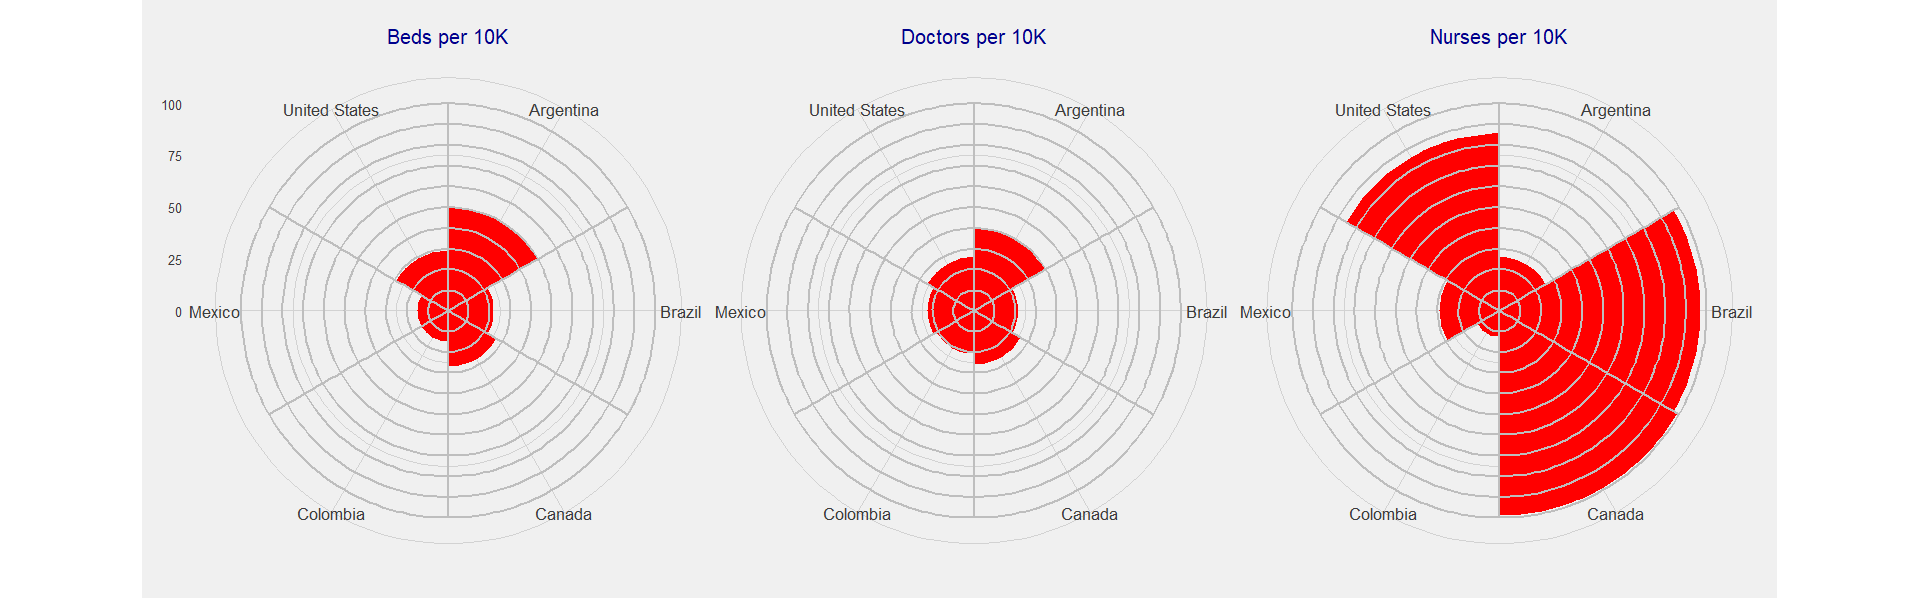
According to the World Health Organization (WHO)’s Global Health Observatory, in 2015 Mexico has 15 hospital beds per 10,000 people, which puts it at 119 out of 181 countries in the world for which data is reported. The country has far fewer resources available compared to other countries of North America and also to other Latin American countries of the similar income per capita and population size. In fact, there isn’t a single indicator of the three shown below where Mexico ranks higher compared to other countries and this situation has worsened over the years as the system has been neglected.
Mexico is also a low spender in health. In 2018 the share of GDP allocated to health was 5.5 percent. For the same year, the Organisation for Economic Co-operation and Development average was 8.8 percent. Compared to regional benchmarks, Brazil dedicated 9.2 percent of GDP to health, Chile 8.9 percent, and Colombia 7.2 percent. As a result of the chronic underspending, most noticeable in the last few years, the hospital sub-system is underequipped and understaffed.
Mexico’s health system has both a private and public sector. Concerning the latter, there are multiple institutions that serve as payers and providers of coverage, which is largely determined by place of employment. The Mexican Institute of Social Security (IMSS), Mexican Civil Service Social Security and Services Institute (ISSSTE), PEMEX, Secretary of Defense (SEDENA), and the Navy (SEMAR) all provide services to formal sector workers based on place of employment, while until 2019 the Popular Health Insurance (SPS), Secretary of Health (SSA), State Secretaries of Health (SESA), and IMSS-Bienestar provide services to the uninsured. Nearly half of all spending in health is paid privately by families mostly in out-of-pocket payments to buy drugs, ambulatory services, and basic hospitalization. The private sector is for those with the means to pay, although it should be noted that many of those without formal benefits resort to utilizing the private sector and paying out of pocket: One estimate suggests 28 percent of the uninsured population reported having had their last ambulatory care delivered privately.
According to February 2020 data from the Secretary of Health, there are 120,240 hospital beds in operating hospitals in Mexico. Including nonoperating hospitals, hospital beds in other types of establishments (external consultancies, general support, and social assistance) and beds utilized for other purposes, the total increases to 145,544. Either of these numbers suggest an even lower number than the one implied by the previously cited beds per capita rate of the WHO in 2015.
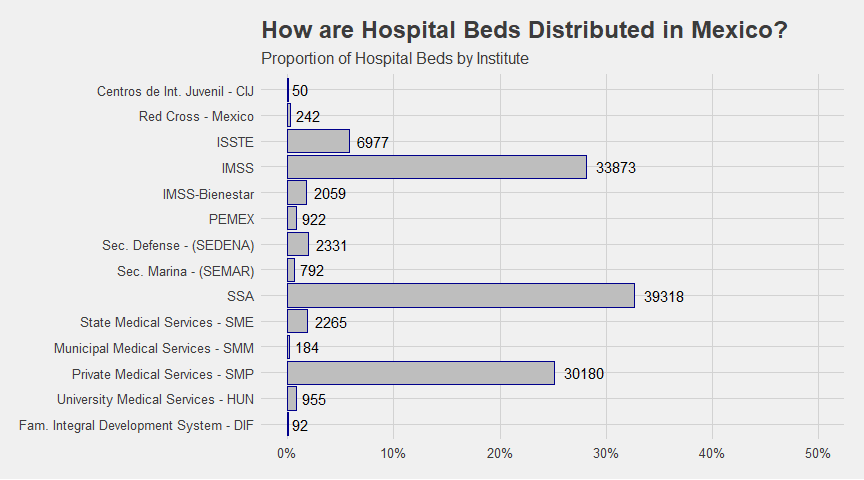
As the figure below shows, 87 percent of all hospital beds in operating hospitals are under the IMSS, SSA, and private medical services (SMP) sectors. This corresponds to 30,180 in the SMP-run hospitals, 33,873 beds in IMSS-run hospitals, and 39,318 beds in the SSA-run hospital system. It is noteworthy that although the private system represents roughly a quarter of the hospital beds it has by far the largest number of operating hospitals at 3,303. This corresponds to 70 percent of the entire system. This discrepancy is explained by the fact that many private hospitals are medium sized. Although some private hospitals are large highly specialized (JCI accredited) medical centers that are concentrated in the large cities, most private hospitals are small (0-20 beds) and cater to medium- and low-income patients and perform low complexity procedures.
How does this correspond to the distribution of the population by service provider? The Mexican health system is characterized by significant distortions, given the peculiar nature of providing entire social security regimes for single employers such as PEMEX, SEDEMA, and SEMAR. These three regimes have significantly more resources than the corresponding percentages of the population with access to them.
Descriptive statistics based on data from the Health and Nutrition Survey (ENSANUT) of 2018 suggest some distortions related to some of the smaller employment-based systems of the public system. The main system relied upon by the population largely matches the resource distribution of the three largest institutes: 19 percent of respondents selected the IMSS as their preferred system; 38.81 percent selected the SSA system; and 31.89 percent selected SMS.
Hospital Stress and Scenario Forecasting
Forecasting hospital occupancy rates is difficult even under normal circumstances, much less during a pandemic. Many assumptions made for this type of forecast are based on estimations of demographic and behavioral health risk factors of greater susceptibility to severe cases. This produces a state of learning on the fly in a scenario where growth is exponential.
The Harvard Global Institute of Health estimates for hospital occupancy for regions in the United States provides a useful methodology, based upon the percentage of the population getting infected over time intervals of six, 12, and 18 months. Based on data collected by the WHO in Wuhan, it assumes 19 percent hospitalization rate in those under 65 years of age and a 28.5 percent hospitalization rate for those over 65, with an average 12-day hospital stay.
Fitting these assumptions to our model using INEGI population estimates for 2020, we then calculate hospital bed availability in both public and private hospitals based on occupancy rates according to the most recent data. This is further explained below. In our first set of forecast scenarios, we estimate the impact of COVID-19 on hospital occupancy rates at the state level with only beds available in public hospitals. In our second set of scenarios, resources from private hospitals are added into the model. Additionally, in this scenario we also add in hospital beds for hospitals that have been out of operation or are awaiting approval to be put into operation as potentially available beds. This forecast assumes the most optimal utilization of resources of the public and private sectors.
This analysis has important limitations, in that it does not consider at-risk demographic and behavioral risks or that access to healthcare will not be the same in a highly unequal country such as Mexico. While it does factor in the importance of age of hospital occupants, it does not consider factors such as obesity, respiratory conditions, and other risk factors. While we know these factors are important, no study yet has been able to quantify the increased likelihood of hospitalization for these population subgroups as has been done with age groups. Once these can be properly estimated, we can consider how this may change stress on hospitals in different regions.
Which scenario is closest to reality? This is unclear as much of it will depend on how the government is able to administer the utilization of the public and private systems. However, given the reliance of low- to middle-income families on private hospitals prior to COVID-19, there is no reason to believe that these resources will not be utilized by the population. Additionally, the federal government recently announced an agreement with private sector hospitals to treat non-COVID-19 patients referred by public institutions to depressurize the public sector hospitals.
This suggests that the forecast including hospital beds of the private sector is a better indication of resources available, although this could be overly optimistic. This model does not consider doctor, nurse, and administrative capacity or bandwidth to optimally allocate patients to where hospital beds are available and provide them adequate care once admitted.
Baseline Occupancy Rates
It is not realistic to expect a flat occupancy rate across all hospitals and regions of Mexico, since some states simply have more efficient uses of their hospitals than others. The map below shows hospital occupancy rates for 2017, the most recent estimates available.
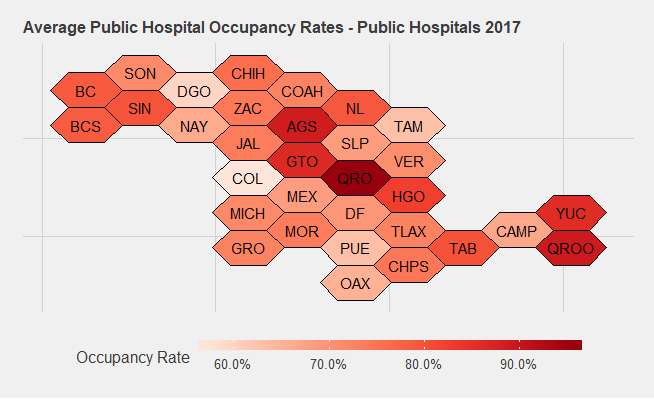
The principal states that jump out are Queretaro and Guanajuato, at 96 percent and 88 percent occupancy, respectively. Many of the states with lower occupancy rates, such as Colima and Durango, are also less populated: Colima has the lowest total population at 785,159 and Durango is the ninth lowest in total population at 1,869,006. This is worth keeping in mind for sharing hospital resources across states: While the data suggests that these states might be the best options for sharing resources to overwhelmed states and hotspots, the fact that these states have fewer people also means they have fewer overall resources and thus less they can contribute overall.
This calls into question the degree to which these occupancy rates may have changed since 2017. Rates in 2013 differed significantly from those in 2017: For example, the states with the highest occupancy rates then were not Guanajuato and Queretaro but rather were Aguascalientes, Baja California, Colima, and Hidalgo. The scenario changed significantly in a four-year window.
For private hospitals, we utilize a flat 33 percent occupancy rate for all states, which is what the most recent hospital entrance data of the private sector suggests. Given the variety in hospital types in the private sector, it is likely that there is significant variation across regions: ones in larger cities tend to be larger, offer higher quality service, and may have different rates of occupancy than the smaller, uncertified ones. Nevertheless, given the lack of available data we cannot factor in variance across states. If this data comes available, we will update the forecast accordingly.
Scenario Forecasts
As is the case with estimates of the United States, the map gets red very quickly and estimated occupancy rates for all states are over 200 percent in all of the six-month scenarios. Even in the most optimistic scenarios, most states are well over 100 percent. For the most optimistic scenario of 20 percent infected in 18-months, the only states below 100 percent are Baja California Sur, Colima, Durango, Mexico City, Sonora, and Tamaulipas.
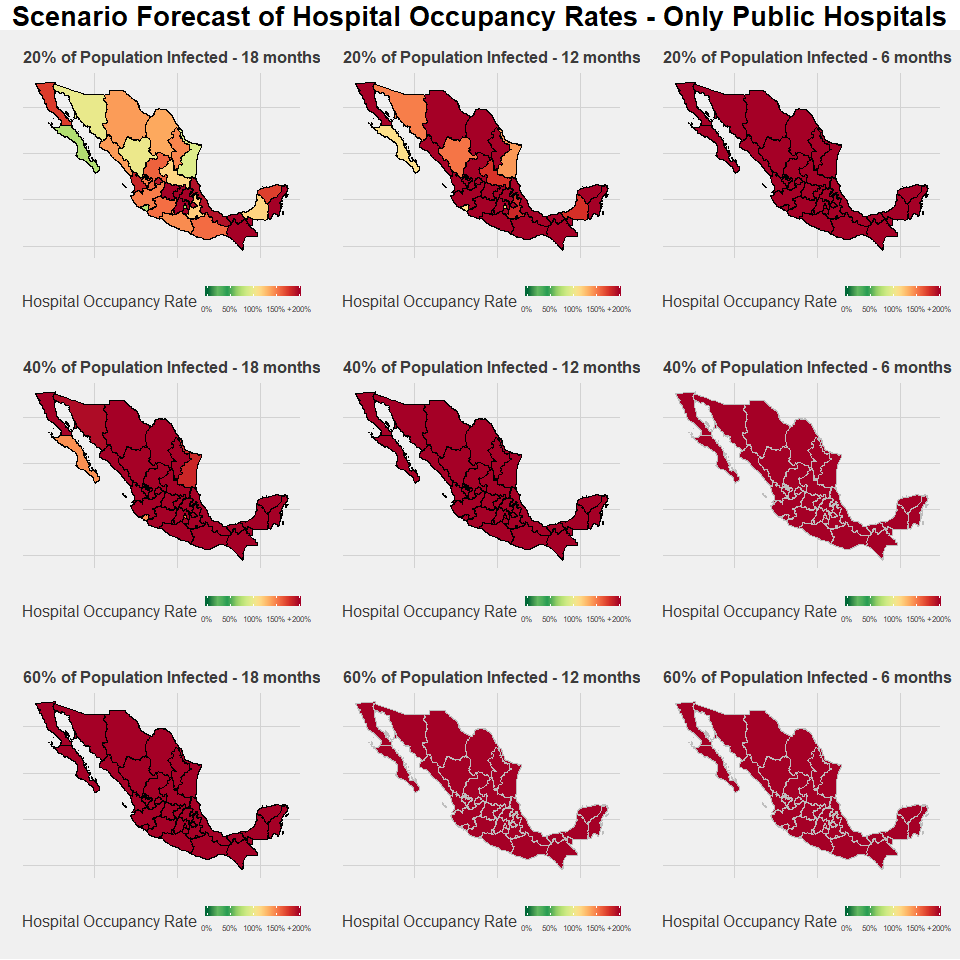
Of particular concern are states with high baseline occupancy rates. Most specifically, the state of Queretaro is at very high risk: If Queretaro were to rely only on public hospital resources, it would face 673.39 percent occupancy rates in the best-case scenario. The forecast under this scenario is not much better for Chiapas, Guanajuato, Hidalgo, and Tabasco, whose rates are all over 250 percent.
In terms of regional disparities, two trends immediately stand out. The first is the significant structural deficit of the southern states of Mexico—Chiapas, Guerrero, Oaxaca, and Tabasco—are all well over 150 percent occupancy rates even under the best-case scenario of 20 percent population infected in an 18-month timespan. Different from Guanajuato, Hidalgo, and Queretaro, there are states with average level baseline occupancy rates but with a greater overall deficit of hospital resources. These are also the states of Mexico where poverty rates are highest, thus it is not terribly surprising that hospital resources also reflect Mexico’s North-South development disparity.
Secondly, there is significant stress in the states surrounding Mexico City in the center. The capital itself has one of the lowest overall stress rates in the country and Puebla is relatively low on the list, but several neighboring states such as the aforementioned Guanajuato, Hidalgo, and Queretaro, along with Estado de Mexico (Edomex), Morelos, and Tlaxcala are all in the top 10 most stressed states.
The map below shows our state-level hospital occupancy rates estimates when private hospital beds are factored in. The overall situation improves significantly with the addition of these resources, which highlights the importance in maximizing their use as the number of patients increase. Nevertheless, the scenario with all resources on the table is still bleak and there is significant risk for all states in each scenario.
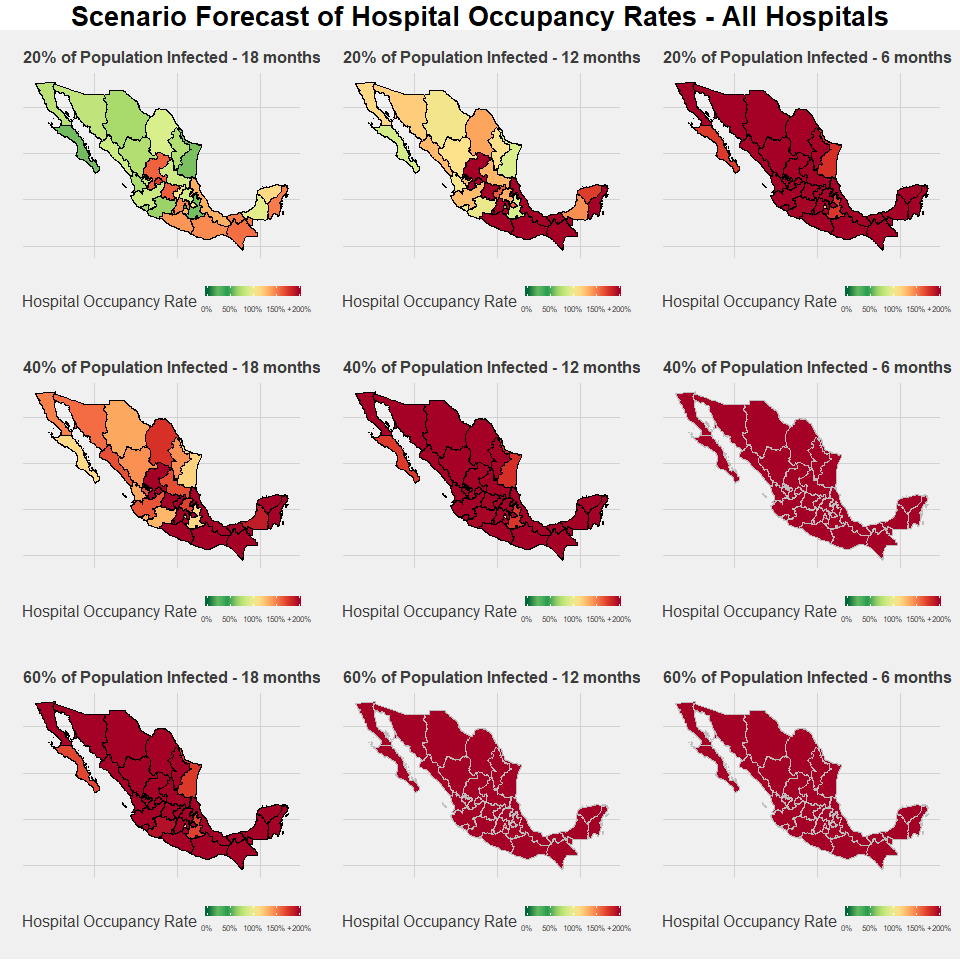
Regionally, there are some similarities and differences compared to the previous model. As before, the southern states are in the red and reach levels over 100 percent well before the northern states. The lack of presence of private hospitals in the south and their strong presence in northern states such as Baja California, Chihuahua, and Nuevon Leon further exacerbate the regional inequalities. The situation is only mildly better moving towards the Yucatan peninsula, and the state of Campeche in particular has more predicted stress given its low baseline rate of public hospital occupancy.
There are significant differences in the states closest to Mexico City and this is where the private network may have the biggest impact. Picking up where we left off in our previous set of scenarios, Queretaro has the most to gain from the disposition of the private network, given that it has the third highest rate of private hospital beds per capita in the country. It moves from the most stressed state to the 13th highest overall, and its best-case scenario predicted occupancy rates drops from 673 percent to 105 percent. Another state of this region that stands to gain significantly from the use of the private network is Hidalgo, with rates in the best-case scenario dropping from 313 percent to 86.29 percent. Despite this, the three states with the highest occupancy rates are Aguascalientes, Guanajuato, and Zacatecas, which are all close to the capital. They face particular burden due to the lack of presence of private hospitals. Other important states of the region, including Edomex and Morelos where many marginalized populations living in the peripheries of Mexico City are located, also have very high comparative levels of stress.
What Next?
This post assesses how Mexico will be impacted by COVID-19 by examining hospital capacity. Even with the limitations outlined, it highlights the overall fragility of the Mexican health system in responding to COVID-19 and the need for measures that go beyond standard operating procedures. Even in the best-case scenarios, many regions will be overwhelmed and face well over 100 percent occupancy rates, which will further push up the death rate as doctors have to make life and death choices on who receives care.
Media reports on overflowing hospitals in Mexico suggest that these scenarios are already a reality for some hospitals and regions. Given the likelihood that the spread of disease will not be uniform, it is necessary to build temporary hospitals in hotspots as seen elsewhere in other countries. Furthermore, as these forecasts highlight, there is a need to rely on the private hospital network. Many states such as Hidalgo and Queretaro are already facing high levels of occupancy in the public system and they will need many more resources from the private sector to even stand a chance as infection rates increase. Another contribution of the scenarios outlined here is that they provide useful information for public officials to assess not only how to bring in new resources from other countries but also how to share existing hospital resources, equipment, and professionals within the country from less burdened states to others. This presents a similar scenario to resource sharing in the United States, where other states have helped New York state deal with their recent peak of cases. The relatively less-stressed states of the north may have a role as distributor and lender, although these same states might face high infection rates given their greater proximity and levels of exposure to people from highly infected areas of the United States, such as the Los Angeles area. Regardless, as it becomes more clear which regions develop hotspots, working out agreements between different state governors and the federal Secretary of Health will be paramount.