Let us know what type of content you'd like to see more of. Fill out our three question survey.
COVID-19 Data Analysis, Part 1: Demography, Behavior, and Environment
This post is one of a series of posts on COVID-19 Data.
Mar 23, 2020
This article was written by DAI’s Gratiana Fu, with contributions from Greg Maly, and Jamie Parr. This analysis is Part 1 of a series on known risk factors associated with COVID-19. We aim to use publicly available data sets to identify national and subnational populations most at risk for infection and case fatality. The analysis will be updated as we receive additional data.
Background
As COVID-19 continues to spread across the world, one of the greatest challenges to response efforts is a lack of data and evidence about infection and case fatality. We will learn more about the virus and the populations most at risk as test kits arrive in the hands of physicians. Ideally, this information will be used to target response efforts at populations most in need, guide policy decisions, inform the donor community, and support decision-making by organizations whose work spans multiple countries.
As a global development company with projects all over the world, this kind of information is invaluable as we think about ways to support our staff and prepare for what comes next. To help DAI and other global development organizations better understand vulnerabilities in the communities in which they work, DAI has begun to develop a method to identify these vulnerabilities.
In this first of a series, we are keeping an updated record of demographic, socio-economic, personal health, and environmental factors that are perceived to be correlated with heightened risk of mortality, using known country and subnational datasets that can help us identify regions at risk. Information from the earliest confirmed COVID-19 cases indicates that some groups of people are at a higher risk for infection and more severe reactions to infection than others. Public health organizations such as the World Health Organization, the Centers for Disease Control and Prevention, and Public Health England have released warnings for those at higher risk to take extra precautionary measures.
Our goal with this series is not to re-invent the wheel. Indices that measure risk and vulnerability do already exist—namely, the RAND Corporation Infectious Disease Vulnerability Index and INFORM (Index for Risk Management) from the European Commission. Both of these indices are currently being used globally to identify vulnerable countries and regions. So why is our approach to assessing COVID-19 risk different?
According to the UNDP, INFORM is “the first global, open-source tool for assessing the risk of humanitarian crises by country.” The index is calculated based on three components—hazard and exposure, vulnerability, and lack of coping capacity. INFORM takes into consideration a variety of hazards and exposure, including natural disasters and human hazards (violence) but does not include biological hazards such as epidemics or pandemics. The RAND Index, on the other hand, focuses entirely on vulnerabilities due to these biological hazards. RAND uses data from six different domains to calculate countries’ vulnerability scores: demographic, political-domestic, political-international, disease dynamics, economic, and public health. This index, however, assesses a country’s ability to prevent and contain an outbreak and not the risk of an outbreak to the country population. It also does not look at any specific disease. In the case of COVID-19, a disease with demographic and medical risk factors, we believe that these factors must be taken into consideration when evaluating risk.
Here we are focusing only on COVID-19, risk factors that are applicable to this particular virus, and how it will affect the general population. We will supplement this analysis with charts and maps. This document will also be updated over time as we learn more.
If you have ideas of datasets and sources that you think would be useful to include in this work, please email our team at [email protected].
Current Theories
Below is a list of factors that have emerged as known drivers of increasing risk of mortality. Some of these theories are based on information released by official public health bodies, while others are factors that could be proxies. As we learn more about possible drivers from the medical community, we will update this analysis with new datasets when possible.
-
Factor 1: Age—People over the age of 65 are at higher risk (CDC)
-
Factor 2: Smoking—Smokers are at higher risk (CDC)
-
Factor 3: Air Pollution (The Guardian)—People living in countries with higher air pollution are at higher risk
-
Factor 4: Medical Conditions—People with serious chronic medical conditions are at higher risk. These conditions include:
Datasets and Analysis
Our analysis pulls from publicly available datasets from a variety of official and reliable data sources. We have aggregated the datasets outlined below, as well as others, in a Google Sheet. For the sake of transparency and collaboration, this dataset is public.
| Indicator | Data Source | Year |
|---|---|---|
| Percent of population, age 65+ | World Bank | 2018 |
| Smoking prevalence, total (ages 15+) | World Bank | 2016 |
| PM2.5 air pollution, mean annual exposure (micrograms per cubic meter) | World Bank | 2017 |
| DALYs due to Cardiovascular Disease | GBD | 2017 |
| Percentage of people ages 20-79 who have type 1 or type 2 diabetes | World Bank | 2019 |
| DALYs due to Chronic Respiratory Diseases | GBD | 2017 |
| Prevalence of raised blood pressure (SBP≥140 OR DBP≥90) | WHO | 2015 |
Factor 1: Age
Age has been noted by all official public health organizations as a risk for getting very sick from COVID-19. Data from the earliest cases in China, Italy, and South Korea have shown that case fatality ratios are higher among older adults. Using data from the World Bank in 2018, we looked at the percentage of the population aged 65 years old and older in each country. The map below shows the global distribution of these older adults—the darker color indicates a larger percentage of the country population while the lighter indicates a smaller percentage.
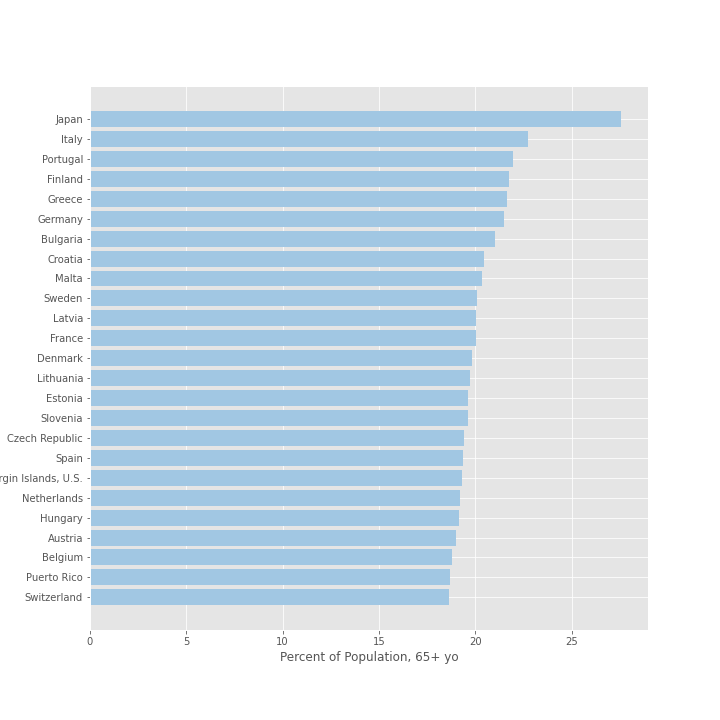
Here we’ve ranked the top 25 countries by their population percentage of older adults. Japan tops the list at 27.6 percent and Italy ranks second in the world with more than 22.8 percent of the country aged 65 years or older.
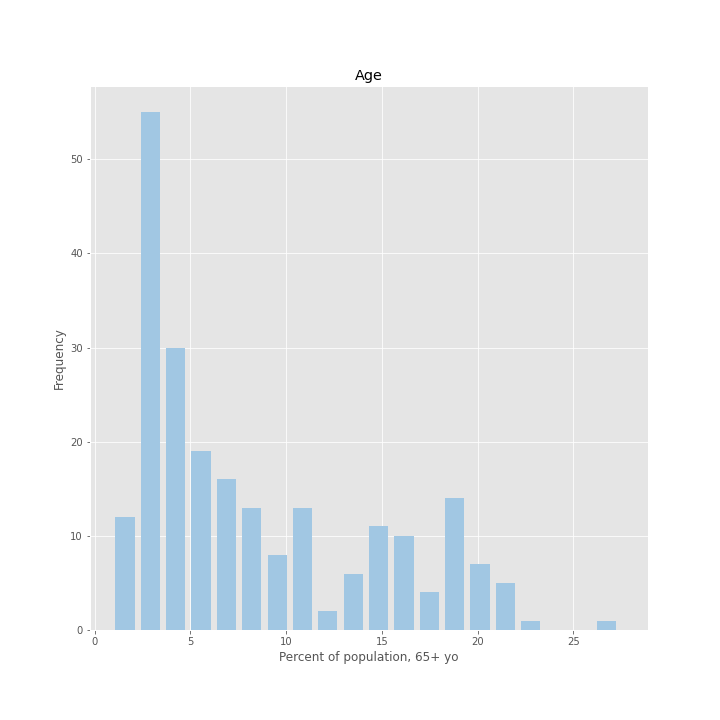
Finally, we looked at the distribution of countries. Most countries have an older population that makes up between 0 and 13 percent of the entire country population. However, there is also a smaller group of countries with a slightly higher percentage of older adults—indicated by the second peak in the graph—ranging between 15 and 20 percent of the country population.
Factor 2: Smoking
Research on confirmed cases in China indicates that individuals with cardiovascular and respiratory conditions caused by tobacco use or otherwise are at higher risk of developing severe COVID-19 symptoms and the crude fatality ratio is significantly higher among those with cardiovascular or chronic respiratory disease than those with no pre-existing medical conditions. Consequently, one may expect countries with higher prevalence of smoking to also be at greater risk in suffering increased pressure on their health systems in responding to COVID-19.
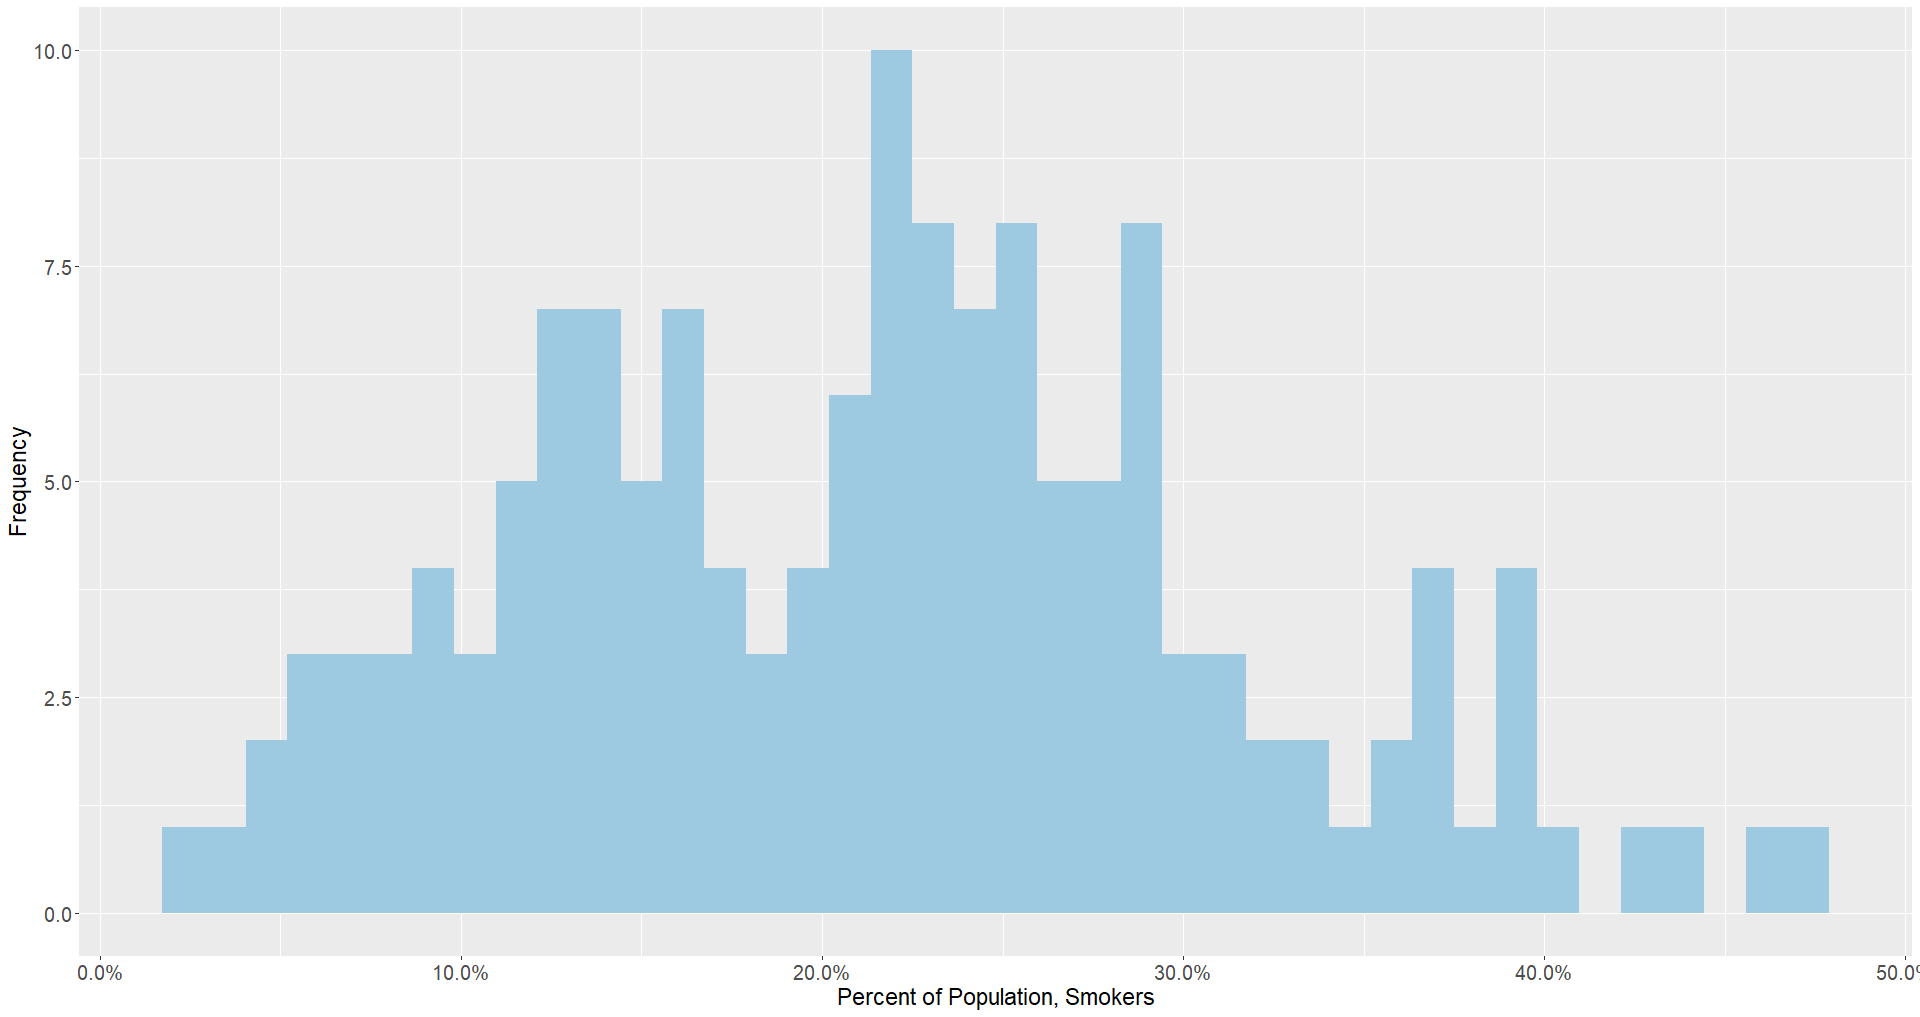
What does the data tell us? Compared to the histogram of countries with populations of people 65 and older, this indicator has a more normal distribution in which the majority of countries are clustered in the 20 to 30 percent range.
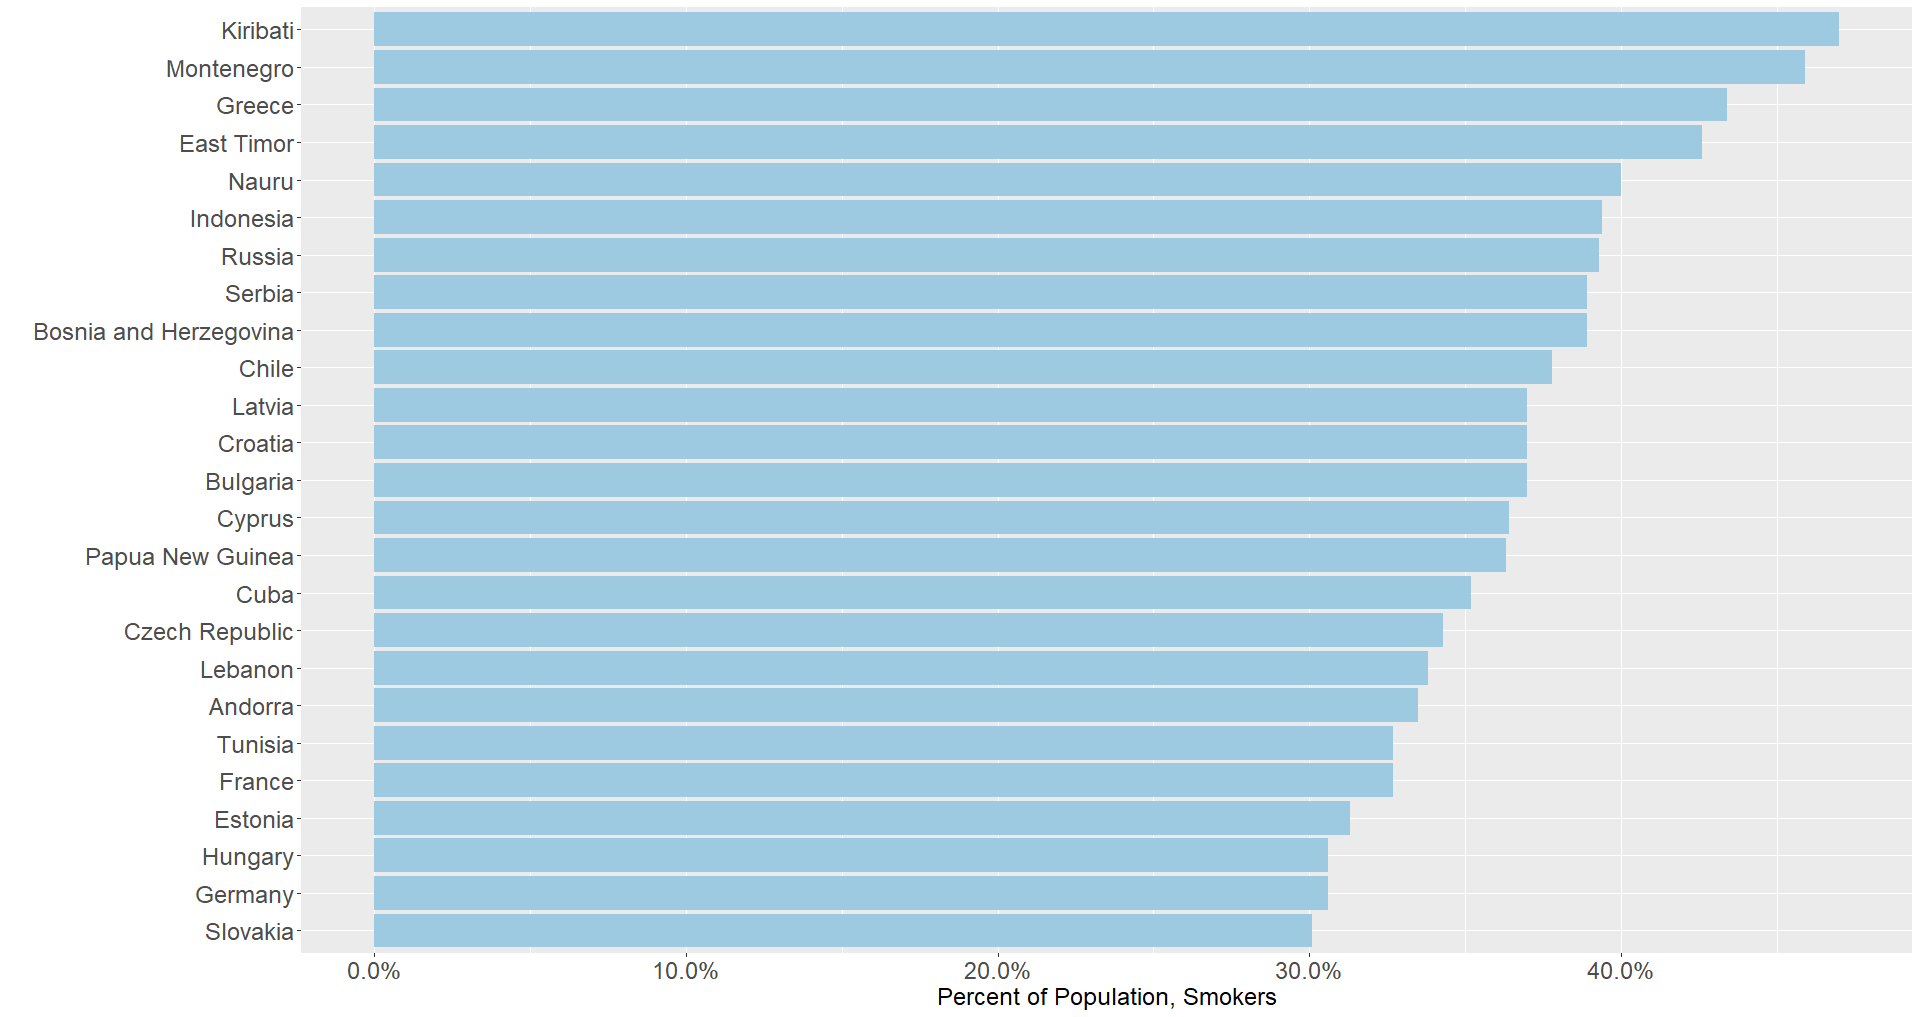
In the graph below, the top 25 countries in smoking prevalence all fall above the 30 percent line. One aspect of smoking is many countries that share common cultural practices from the same regions appear together: there is significant representation of countries from the Oceania, Middle East and North Africa, and Eastern and Southern Europe regions. While most countries in this graph do not appear in the Age +65 section, there are a few notable exceptions from Southern and Eastern Europe. Among others, Bulgaria, Estonia, Germany, Greece, and Hungary all might face increased stress as the number of cases intensify.
Factor 3: Air Pollution
For many of the same reasons mentioned with regards to smoking, exposure to air pollution is a major concern as it relates to coronavirus. The PM2.5 air pollution, mean annual exposure (micrograms per cubic meter) of the Global Burden of Disease Study (2017) provides some indication of which countries are at particular risk.
Exposure to air pollution has a significant amount of variance between countries, as the histogram below displays. While the majority of countries are below 25 percent, a significant amount of outliers remain.
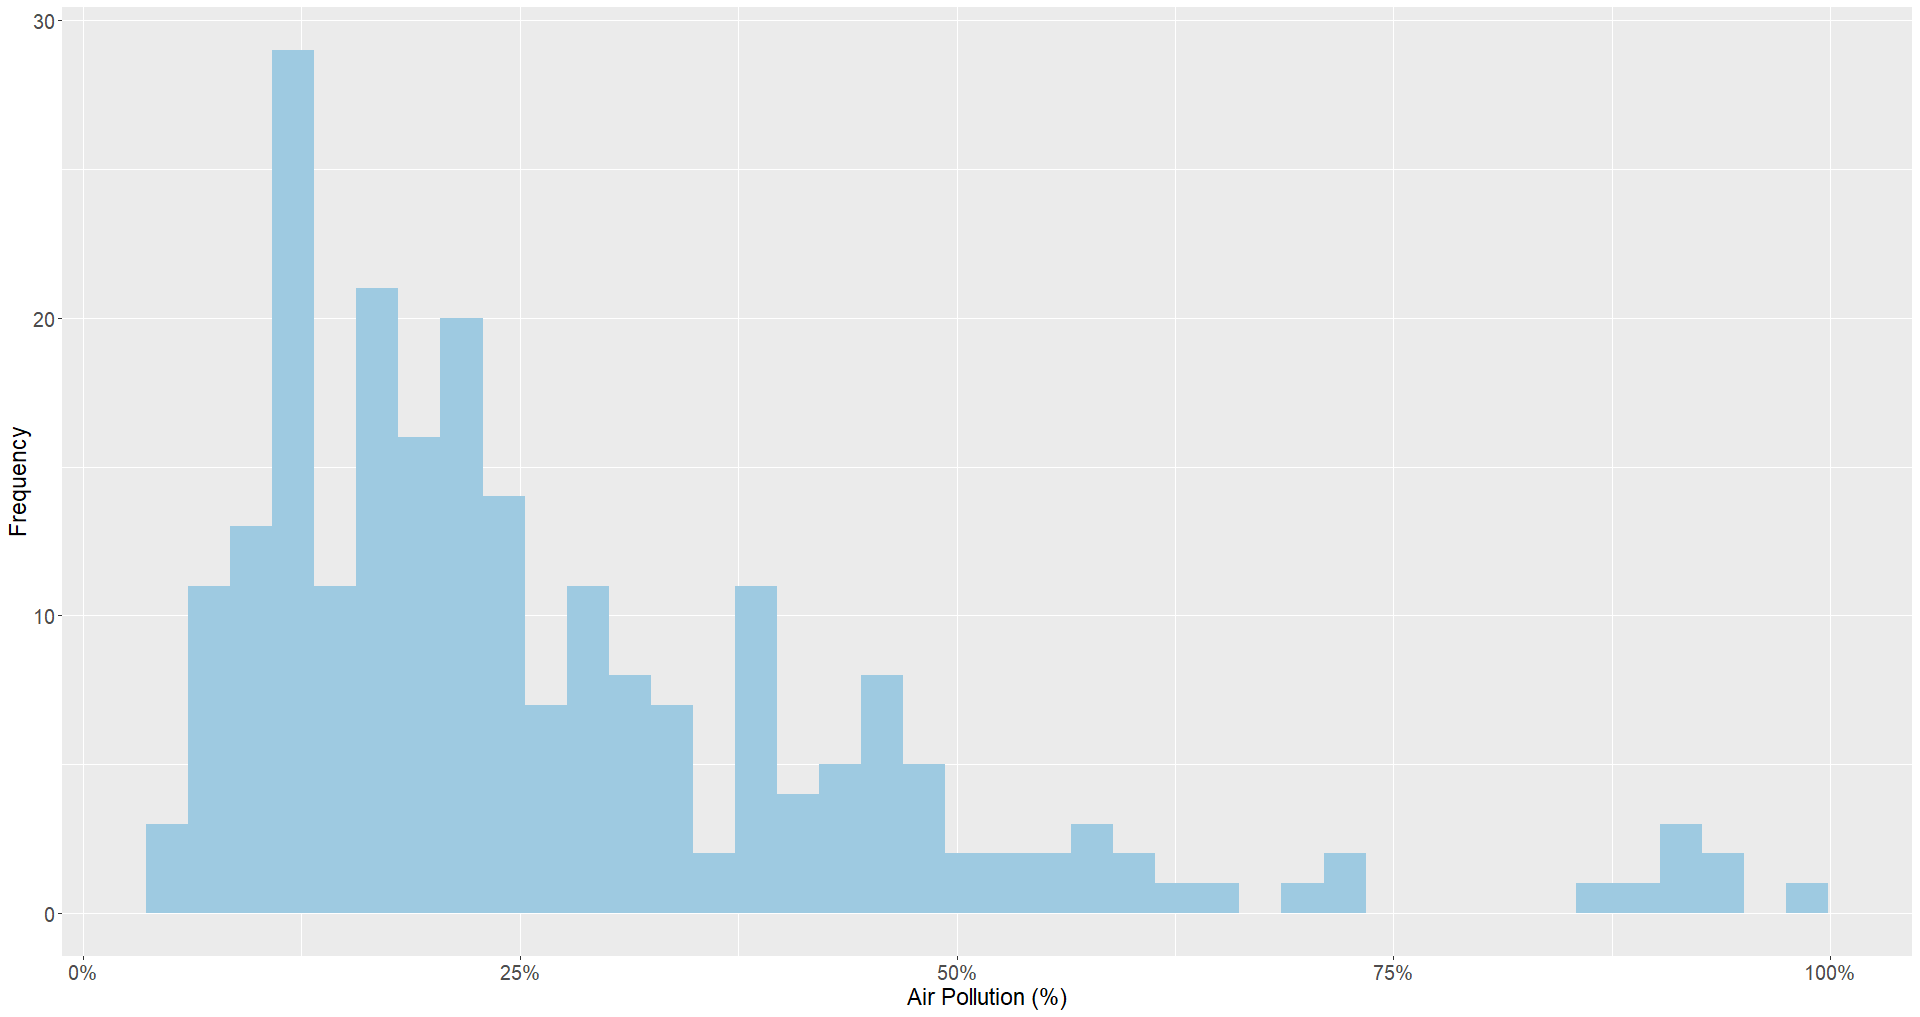
The graph below displaying the top countries by exposure to air pollution shows a different set of countries than before. There is greater representation of low- and middle-income countries in this graph. In some cases, this can be attributable to the greater economic presence of heavy industry in these countries. Several countries where DAI has a strong presence have particularly high air pollution exposure, including Afghanistan, Egypt, Iraq, Libya, Nepal, Nigeria, Pakistan, and Uganda.
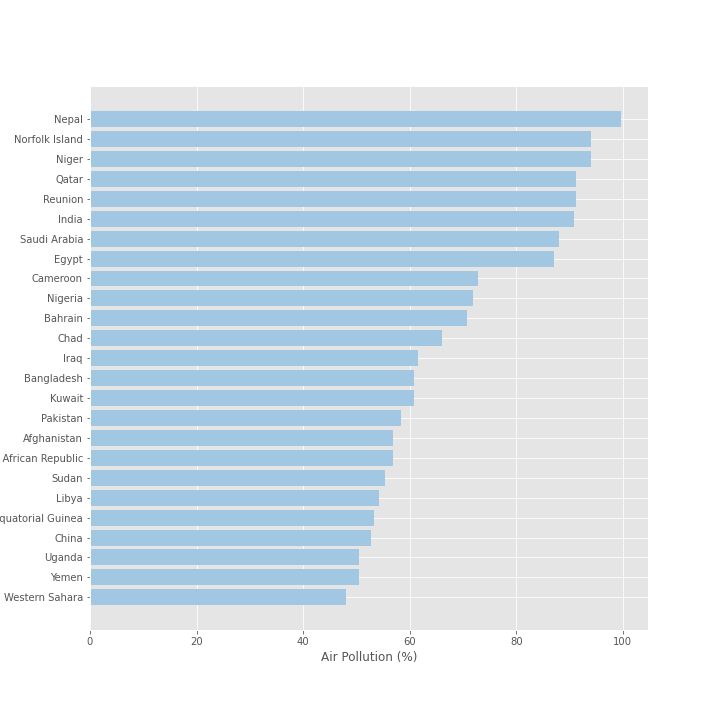
It is worth noting potential identification issues and the presence of mediating factors in dealing with this variable. Several other variables, most notably the percent of labor force working in industry and population density, are all correlated at the country level. At a more granular level, it remains unclear how these factors will interact and what effect they will have on infection and case fatality ratios. Will individuals working in industry living in these countries be at greater risk than those who do not? Will countries with a greater population density suffer more infections, thereby leading to higher case fatalities for countries with worse air quality? Only with more data will we be able to answer this question more precisely.
Underlying Medical Conditions
In addition to these demographic and external factors, the WHO released warnings to people with underlying medical conditions to avoid crowded places as these conditions put people at greater risk for infection and death. These conditions specifically noted:
-
Cardiovascular (heart) disease
-
Respiratory condition
-
Diabetes
-
Hypertension
We pulled data from the Global Burden of Disease Study 2017 on Disability Adjusted Life Years (DALYs) lost due to cardiovascular disease and chronic respiratory disease and World Bank data from 2019 on country prevalence of type 1 and 2 diabetes. DALYs are a commonly used measure of disease burden expressed as the number of years lost due to illness, disability, or early death.
Medical Condition A: Cardiovascular Disease
The global distribution of DALYs due to cardiovascular diseases is shown below. From this, we can see that Eastern Europe is more affected by cardiovascular diseases, indicated by the darker purple color.
From our country rankings below, we can see that many countries that have high disease burden are in Eastern Europe, including Bulgaria, Georgia, and Ukraine. Guam is the only country in the top 25 countries that is not in Eastern or Southern Europe.
_hist.png)
Our last look at the burden of disease of cardiovascular disease indicates a large group of countries with DALYs falling in the 0.10-0.20 range. There are progressively fewer countries that have DALYs higher than 0.20.
_bar.png)
Medical Condition B: Respiratory Condition
Respiratory conditions put people at higher risk for COVID-19. Symptoms of the virus include pneumonia, sneezing, and sore throat—all conditions that affect the respiratory system. We used data from the Global Burden of Disease Study 2017 to identify disease burden (measured in DALYs) due to all chronic respiratory diseases. This broader category of diseases includes silicosis, asthma, and lung disease.
No major patterns appear in the map below. We can see a mild concentration of respiratory conditions in Southeast Asia. North Korea and Papua New Guinea, however, are most affected by these conditions.
In our country rankings, we can see more clearly which countries are more affected by these respiratory conditions. North Korea and Papua New Guinea are experiencing a much greater disease burden than the other top-ranked countries. The list of top 25 countries, however, does not appear to have a trend and includes high-, low-, and middle-income countries from around the globe.
_bar.png)
The histogram below shows us that the majority of countries have a disease burden ranging between 0-0.06 DALYs. Only 10 countries have a disease burden greater than 0.06 DALYs.
_hist.png)
Medical Condition C: Diabetes
We pulled data from the World Bank on country prevalence of diabetes, include both type 1 and 2 diabetes. In the chart below showing the 25 countries with the highest prevalence of diabetes, the overwhelming majority are island nations including Kiribati, Marshall Islands, Mauritius, and Tuvalu. Marshall Islands has the highest diabetes prevalence at more than 30 percent.
_bar.png)
Our map below does not give too much more information about country-specific prevalence—the islands are too small to clearly see at the global level.
The histogram below shows a right-skewed distribution—most countries in the data have a prevalence below 13 percent.
_hist.png)
Medical Condition D: Hypertension
Hypertension, also known as high blood pressure, is the last medical condition we explore. The measure we used is the percentage of country population that has high blood pressure, according to the WHO guidelines (Systolic BP≥140 or Diastolic BP ≥90). Eastern Europe and Sub-Saharan Africa have, regionally, higher percentages of hypertension.
_bar.png)
The histogram has a different distribution than the other medical conditions we explored. For the previous conditions, most countries and clustered in the lower range of the indicator with a few country outliers measuring on the higher side. In this case, a few countries have a prevalence of less than 18 percent while the majority of countries are experiencing hypertension prevalence of about 18 to 32 percent.
_hist.png)
Next Steps
In this paper we described factors that may be correlated with COVID-19 mortality, and countries to watch when thinking about at risk populations. This factor analysis is phase one of our COVID-19 data work. Stay tuned for our next analysis. We’ll be taking a deeper dive into country-level preparedness and response for health emergencies.