Visualizing Hierarchical Data: USAID’s $8.5 Billion Global Health Initiative
Aug 8, 2016
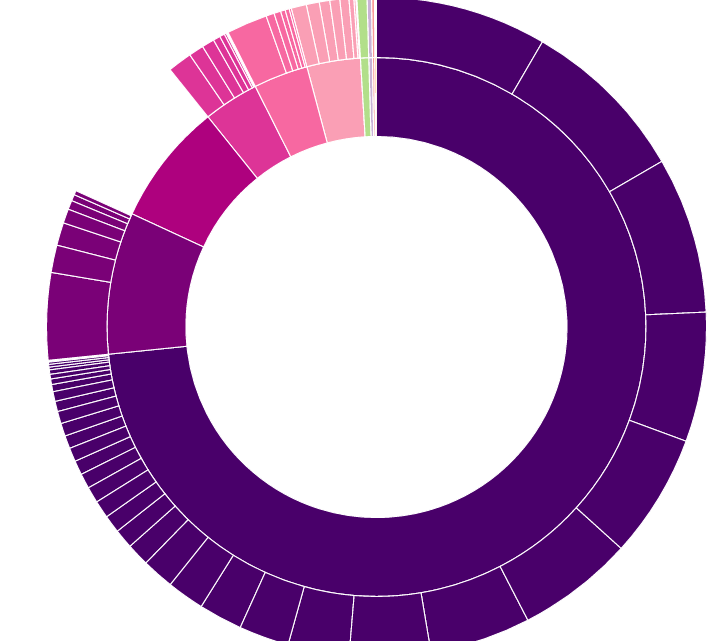
Budget data is notoriously difficult to analyze. The volume of data can be high, the long tables are unwieldy, and the structures are almost always multilayered, making it difficult to visualize. But with some of the advanced interactive visualization tools we use at DAI, we can analyze and present even complex data more clearly. In this example, we use a public data set from USAID’S 2017 budget request and we visualize it in a sunburst:
A sunburst visualization for the Global Health Initiative’s 2017 Budget Request

An interactive sunburst visualization of budget data
Sunbursts are a great way to see hierarchical data all at once, and with a little JavaScript we can make them interactive, too. Thanks to D3 this is all easier (and free). The code for this visualization was derived from Kerry Roden’s work.
The budget data came from the PDF files on USAID’s website. Specifically the data source is Table 13: Global Health Initiative-FY2017 Request on page 35 of the Congressional Budget Justification for Foreign Assistance for FY2017.
Compare the interactive visualization with this table spread across four pages in a .pdf. Which is easier to understand?
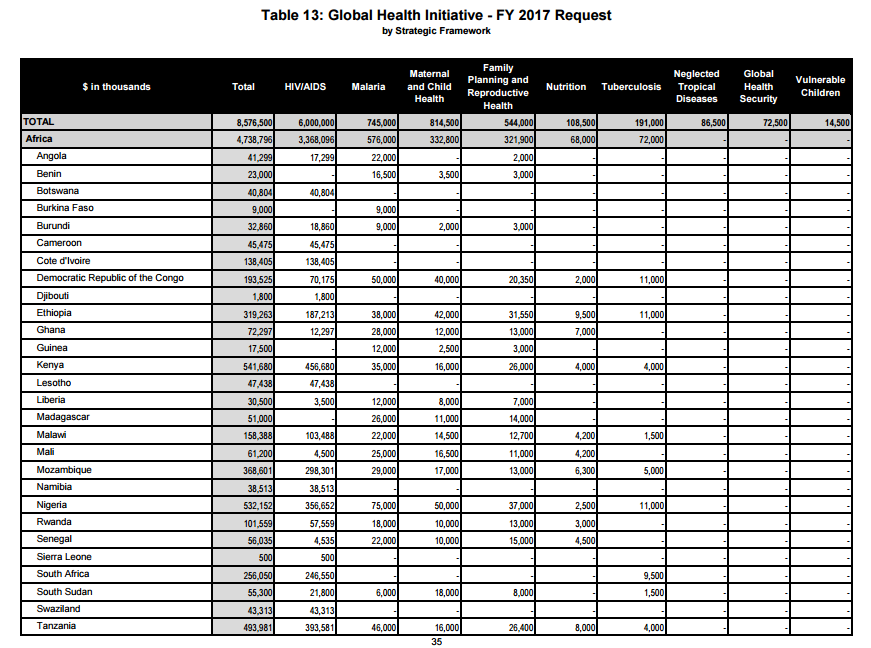
One of four pages from the USAID 2017 Global Health Initiative Budget Justification
Other common methods for hierarchical data visualizations are dendograms and treemaps. You can read our previous post on dendograms [here].
Data, especially large and hierarchical data sets, are notoriously difficult to understand, and often elicit either a disengaged or overly detailed reaction. Let’s hope that visualizations like these can help improve our understanding of complex data, and in turn, increase transparency and efficiency.