Let us know what type of content you'd like to see more of. Fill out our three question survey.
“S3” Site Selection System: A Data-Driven Decision-Making Tool for Effective Engagement
Jan 29, 2018
Recently while on assignment in Haiti, a project manager for a local agricultural development project asked my team why we weren’t targeting certain rural communities. According to him, those communities are the ones that could really benefit from the type of work we were doing. While we had good reason to work where we were working, the question stuck: How can we be certain that we are targeting the right communities?
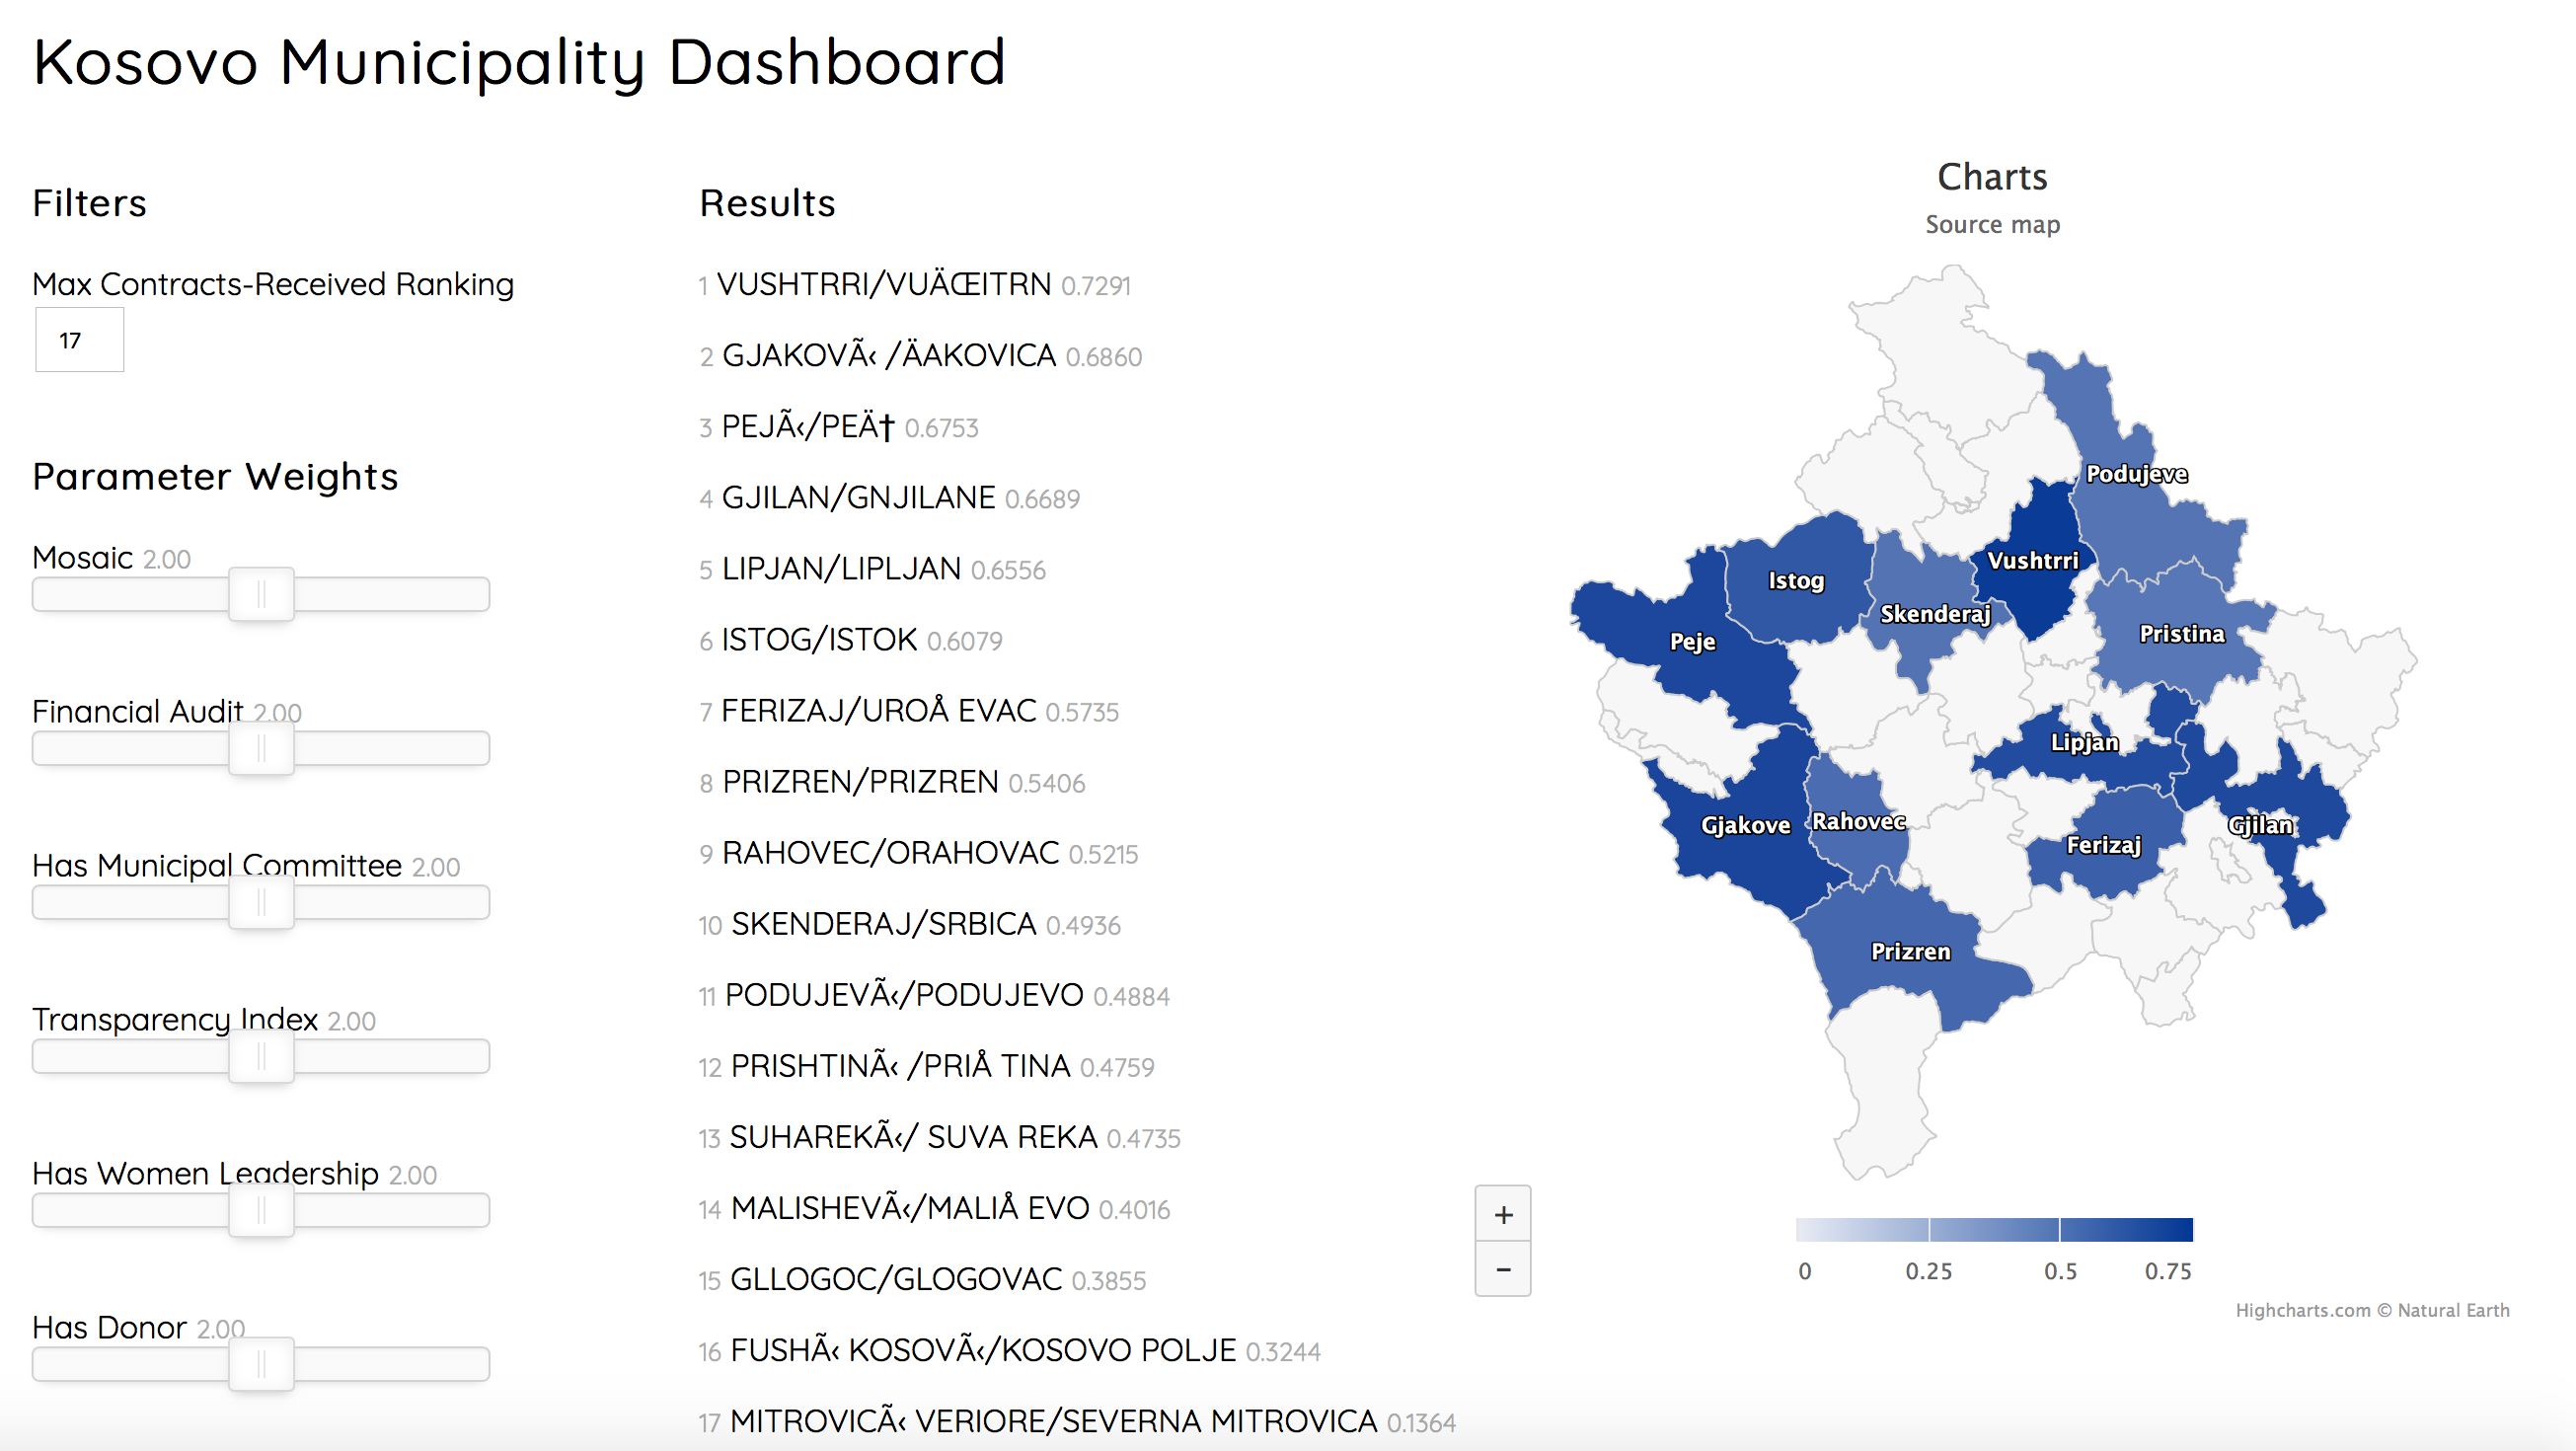
You’re working on a project looking to reduce violence in schools in Honduras—which schools should you prioritize given that you can’t work across all of them? You’re working on a governance-strengthening project in Kosovo—in which localities will you be most effective? Most importantly, what does a decision-making process based in evidence and aligned with donor priorities look like?
In an attempt to make sure that we are consistently able to answer these questions, we have developed a data-driven methodology to identify and engage with beneficiaries that we call the Site Selection System (S3). This process provides projects with up-front guidance on decision making, developing and applying a set of criteria for assessing a range of potential intervention sites or beneficiaries, enabling them to make evidence-based decisions and build a strong case for targeted interventions. To date, we have successfully deployed S3 from Kosovo to Honduras to Iraq.
The Process:
-
Constituent Consultation and Criteria Formulation: At the earliest possible stage, we consult with key project staff, technical experts, and client donor representatives to create a unified vision for priorities with regards to targeting beneficiaries. Together we develop a beneficiary profile from which priorities can be derived. Then we develop clear and measurable selection criteria based on the desired impact of the project.
-
Data Surveying and Collection: With a beneficiary profile and a set of measurable criteria in hand, we then work with projects to identify available datasets, or curate new ones, from which evidence of suitability of individual beneficiaries or geographic locations can be drawn. These can include national-level data such as school matriculation rates, or highly localized data such as crime rates in one municipality. Where necessary, we design data collection plans to supplement what is already available.
-
Weighting and Scoring: The next stage involves crunching the numbers: 1) determining a scoring algorithm that allows for beneficiary or site ranking according to the criteria set out, 2) applying this scoring algorithm to the data collected in the second step, 3) designing a weighting system to build flexibility into the system, allowing projects to adaptively apply weighting according to shifting priorities, and 4) developing an interactive visual to allow the project to apply weights dynamically and prioritize to inform and drive decisions.
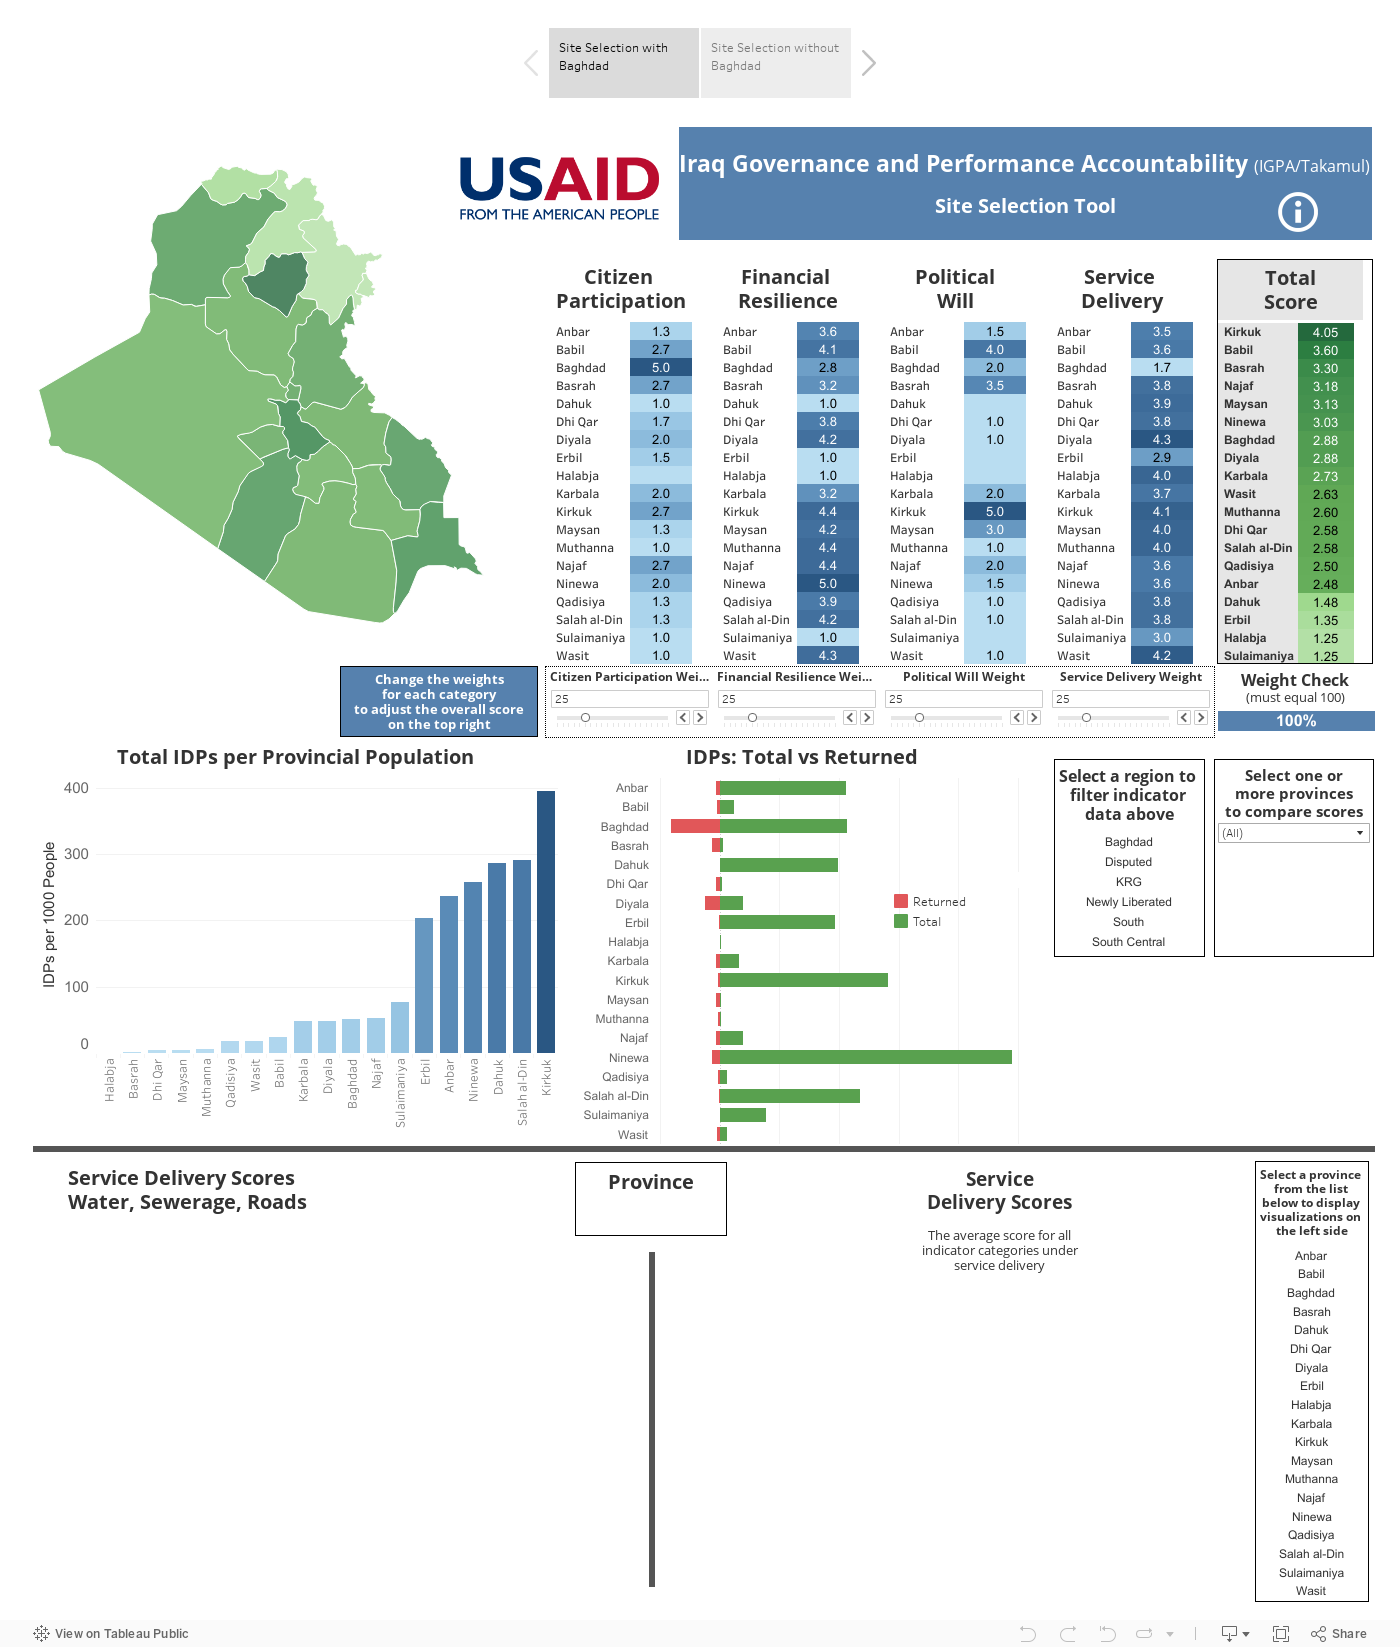
Case Study: Prioritizing Iraqi Provinces for Improved Governance and Service Delivery
As part of its transitional process, the Government of Iraq is working to decentralize many government functions to the provincial level in an effort to combat corruption and enhance responsiveness. DAI is supporting this transition through the Iraq Governance and Performance Accountability (IGPA/Takamul) project, addressing barriers to decentralization and working with provincial governments across the country to strengthen service delivery. However, to mobilize quickly, the project team needed to select six priority provinces for the first phase. In keeping with the S3 methodology, this required a set of criteria, a list of proxy variables for each criteria, a methodology for selection, and an interactive platform for displaying the results and collaborating with USAID to select the final provinces. The team defined a list of five criteria to determine the most compelling provincial environments:
-
Citizen Participation
-
Financial Resilience
-
Political Will
-
Service Delivery
-
Demography and Regional Representation
For each of these criteria, the team defined a set of proxy indicators tied to quantitative data. For example, “Number of active civil society organizations” for citizen participation, “operating budget” and “budget execution rates” for financial resilience, and “health workers per capita” and “potable water” for service delivery.
The methodology used a quintile scoring structure to grade performance relative to other provinces. High scores were defined as a more permissive operating environment. The scoring model also included a weighting function to allow the project and USAID to collaboratively adjust the importance of specific criteria.
After designing the methodology and collecting the data, the team built an interactive dashboard to perform the site selection itself. Together with USAID, the team used the dashboard to calculate final scores based on the aggregated data and a system of variable weighting. The dashboard includes a two-step process: (1) weighting and (2) filtering. The weighting determines provincial scores, and the filtering functions allows the user to narrow the set of provinces based upon location. The platform allows the user to identify specific insights and draw conclusions from provincial data, helping the project and USAID make evidence-based decisions about where to launch project activities during the first phase.
The IGPA Site Selection platform can be seen at the link below. Feel free to visit, explore, and consider how your projects might use data to target beneficiaries.
https://public.tableau.com/views/SiteSelectionTool/Story1?:embed=y&:display_count=yes