Let us know what type of content you'd like to see more of. Fill out our three question survey.
Remote Sensing Series Part 2: Landsat is the Stalwart of Satellite Imagery Platforms (and it’s Free!)
This post is one of a series of posts on Remote Sensing.
Jan 18, 2017
DAI is in a stellar mood about the upcoming SatSummit in Washington, D.C. Part 1 of the remote sensing series can be read here.
Some incredible things were happening in the United States in 1972: Bill Withers’ “Lean on Me” was the No. 1 song on the radio; the first “Godfather” film was released; and NASA launched the first in a series of satellites designed to provide consistent and reliable coverage of the earth’s land cover. The platform—the Earth Resources Technology Satellite or ERTS-1—was developed in partnership with the U.S. Geological Survey (USGS), which agreed to handle the storage, archiving, and distribution of the data products. The second satellite, eventually renamed Landsat 2, launched in 1975, operating in parallel with ERTS-1 for a few years until the original satellite was decommissioned in 1978.
In the late 1980s, the program hit hard times, with few people or organizations using the data and heightened scrutiny from Congress. It was saved only through direct intervention from then-Vice President Dan Quayle, who perhaps should be remembered more for saving Landsat than an unfortunate incident with a chalkboard and a root vegetable.
Today, Landsat 8 and Landsat 7 operate concurrently.
Accessing Landsat Data
Here is the mission schedule from USGS:
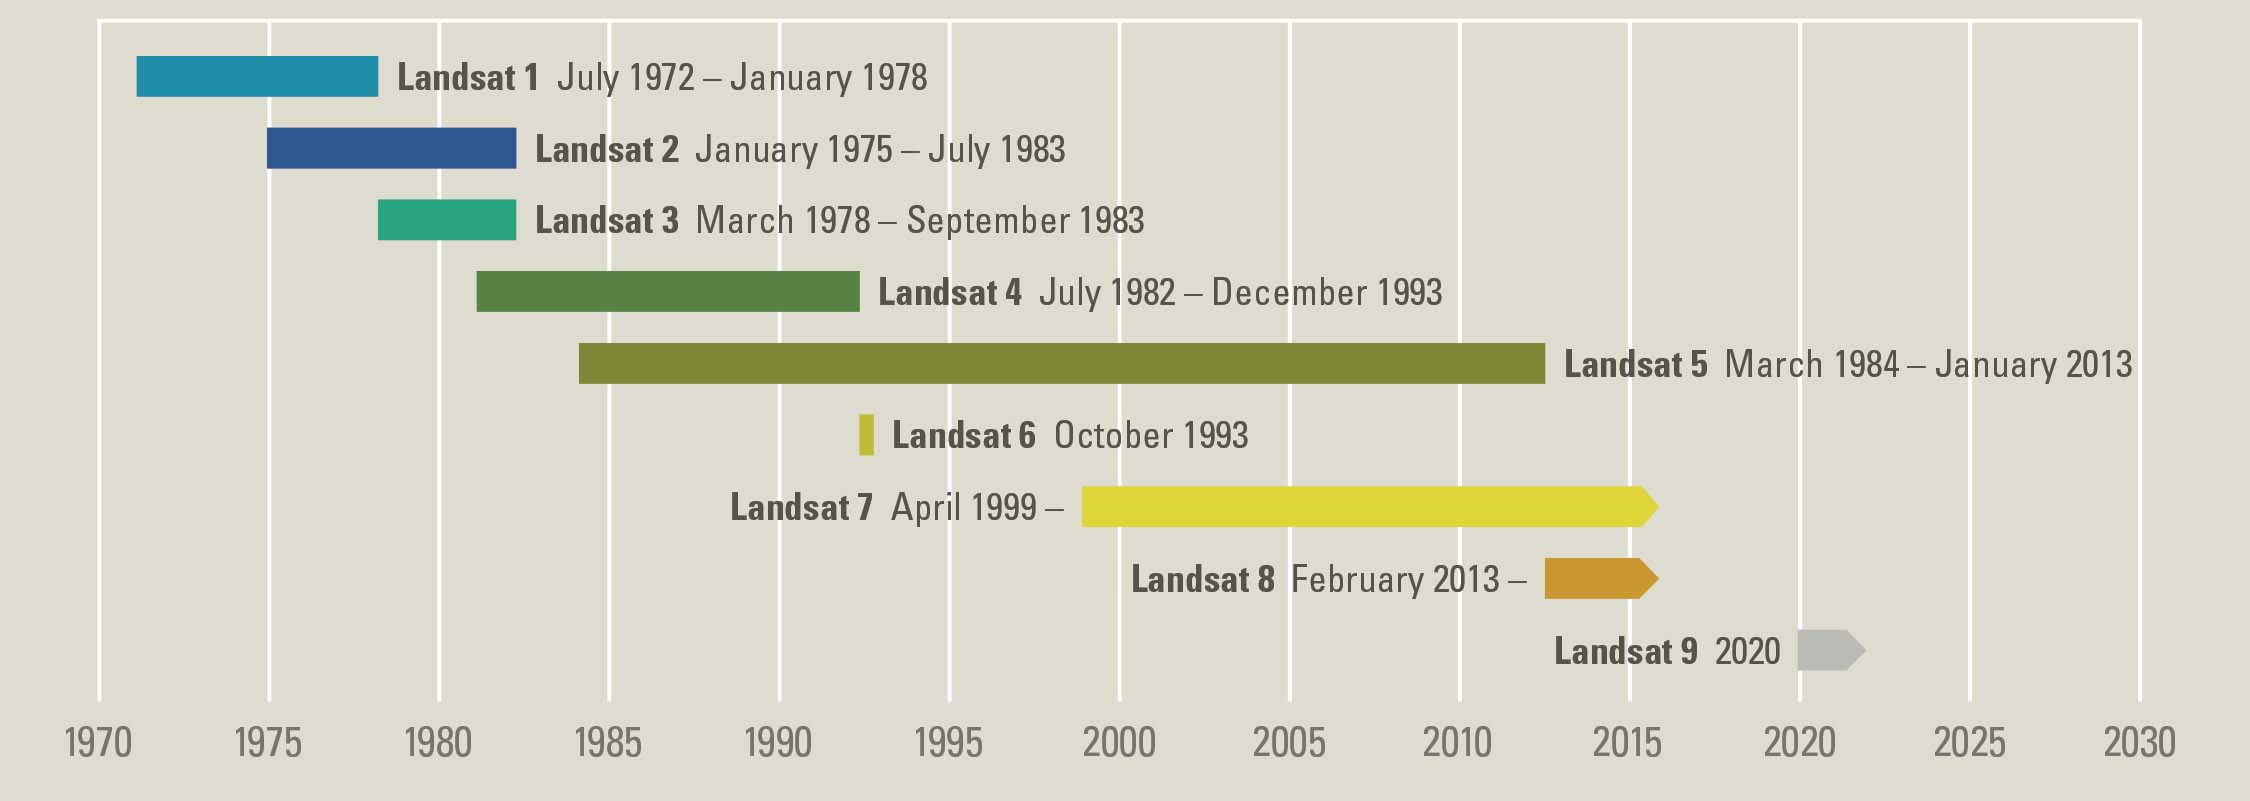
Landsat mission schedule. Image credit: USGS
Landsat data is free to the public. To get access to this treasure trove, you can go through the traditional USGS Earth Explorer Site. This is one of the main publicly operated distribution sites for Landsat data (and quite a few other programs). To get at the data, you simply select the point or area of interest and then click a button to query for all possible results. After selecting the imagery you want to see, you can select a preview to get a sense for the footprint. Here is a scene just west of Madison, Wisconsin.
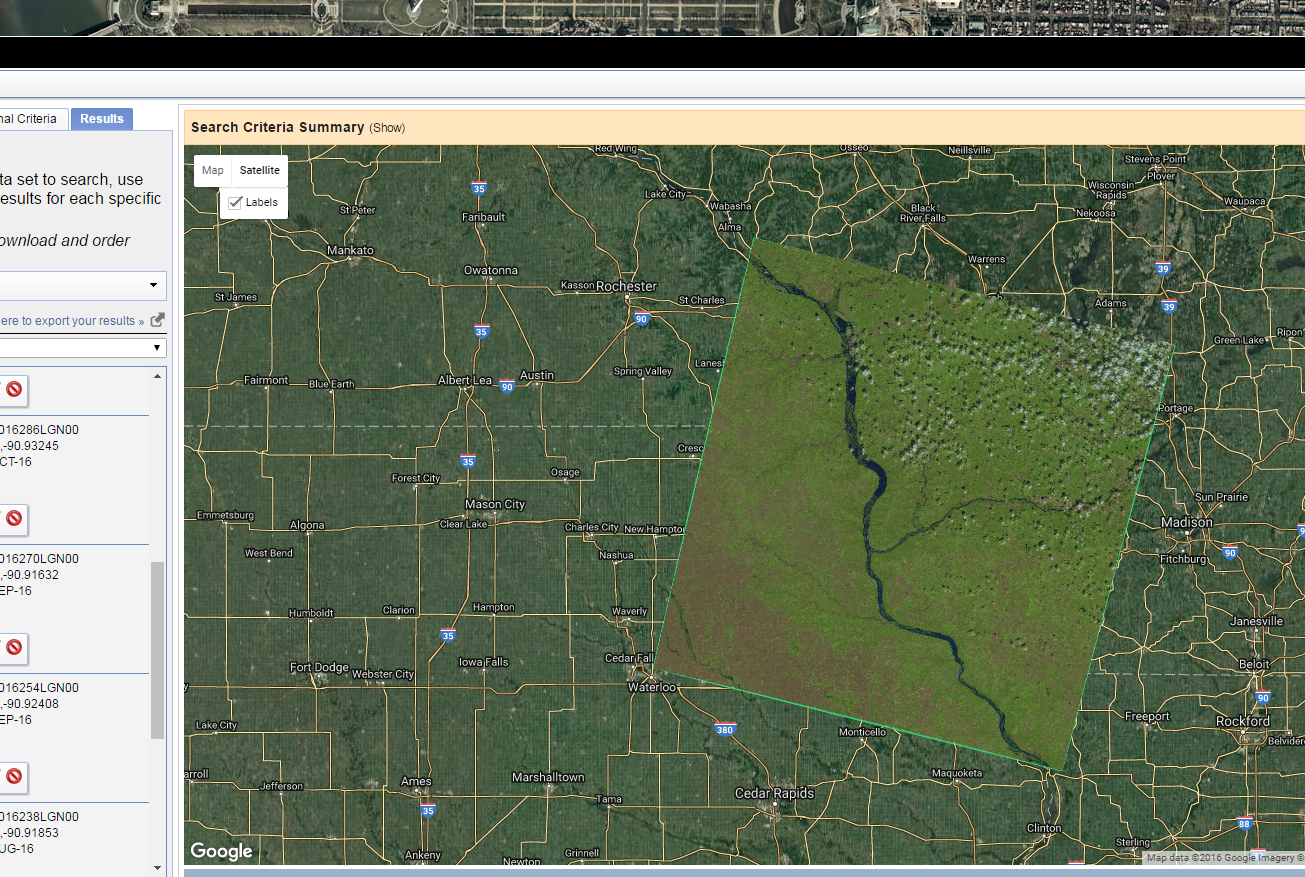
Screenshot from the Earth Explorer Site
As a registered user, when you download a scene you get 12 geo-referenced imagery files—one for each of the 11 Landsat 8 bands, plus one Quality Assessment (QA) band. Geo-referenced images have location information, allowing them to be used by geographic information systems (GIS). The QA band describes characteristics of the scene based on cloud cover, the presence of snow or ice, and several other indicators that could alter numeric calculations of the image.
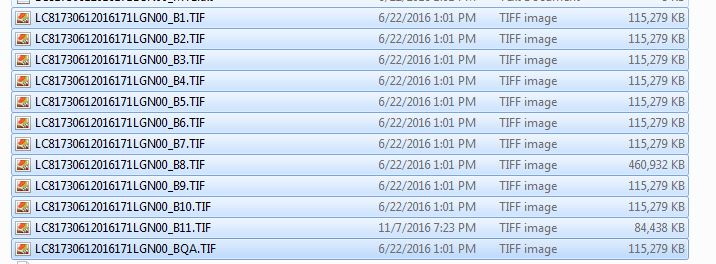
Each band for one scene downloaded from the USGS Earth Explorer Site
Private cloud companies are helping out with data distribution, too. You can download the data from Amazon Web Services, which has Landsat 8 imagery through 2015. Here is a scene from the DRC.
Image Composition
So what do you do with this data? You can construct color composite images, or an image composed of any three arbitrary bands by layering them together. True color composite images are made with the bands visible to humans: red, green, and blue or 4-3-2 for Landsat 8. You can also compose an image using any of the layers, creating what is known as a false color composite. Here are a few common band combinations:
| Emphasis | Bands |
|---|---|
| Natural color (true color) | 4-3-2 |
| Urban areas | 7-6-4 |
| Color infrared (vegetation) | 5-4-3 |
| Agriculture | 6-5-2 |
| Atmospheric penetration | 7-6-5 |
| Healthy vegetation | 5-6-2 |
| Land and water | 5-6-4 |
| Natural with atmospheric removal | 7-5-3 |
| Shortwave infrared | 7-5-4 |
| Vegetation analysis | 6-5-4 |
Common band combinations: source ESRI
So, if you want to create a 5-4-3 image you need to combine layers (you guessed it) 5, 4, and 3. In QGIS, a free cross-platform GIS application, you can combine these. Simply select Raster > Miscellaneous > Build Virtual Raster to combine the three layers into one. This MapBox blogpost from 2013 has a great description of the individual bands and their combinations that might be useful.
A Practical Example
Let’s give this a try by examining the far western region of Nepal, where DAI implements an integrated watershed management project called PANI. We want to see where healthy vegetation is during two different times of the year. Nepal has monsoon seasons, so we expect to see variation in vegetation health immediately after monsoon season as compared to five months later when it’s dry. Traditionally in June and July, the monsoon season is inching later in the year because of climate change.
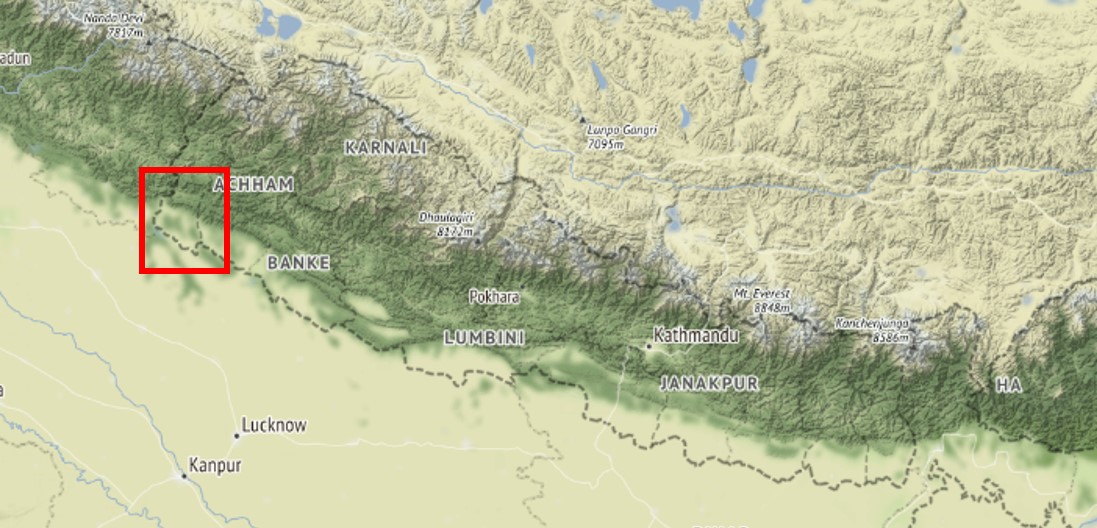
Here is the region in Nepal we are examining with remote sensing
Let’s use data from August 2016, right after the rains. I downloaded the layers for this time period and combined them into a 5-6-2 image that highlights healthy vegetation in red. We see a fairly swollen Mahakali River and a fairly even spread of vegetation highlighted in red.
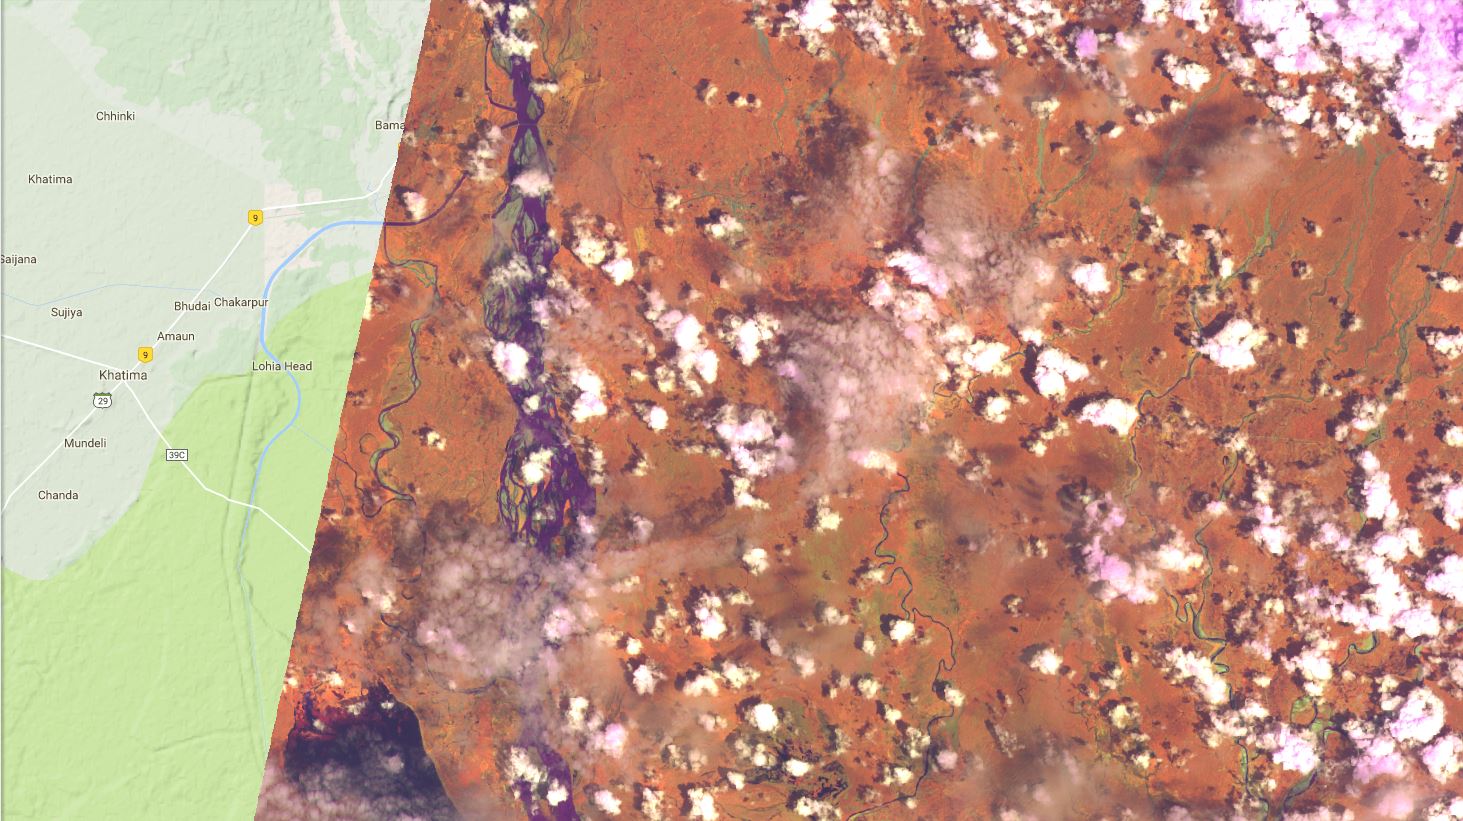
A 5-6-2 image of western Nepal in August 2016, soon after monsoon season
Now let’s look at a dry time of the year. Like right now for example: January. In this image, the river clearly has less volume and there is a larger contrast in vegetation health. The deep dark red appears to be slightly less healthy than the bright red areas closer to town. A reasonable guess is the bright red areas are being irrigated by farmers and the national park and mountain areas are left dry.
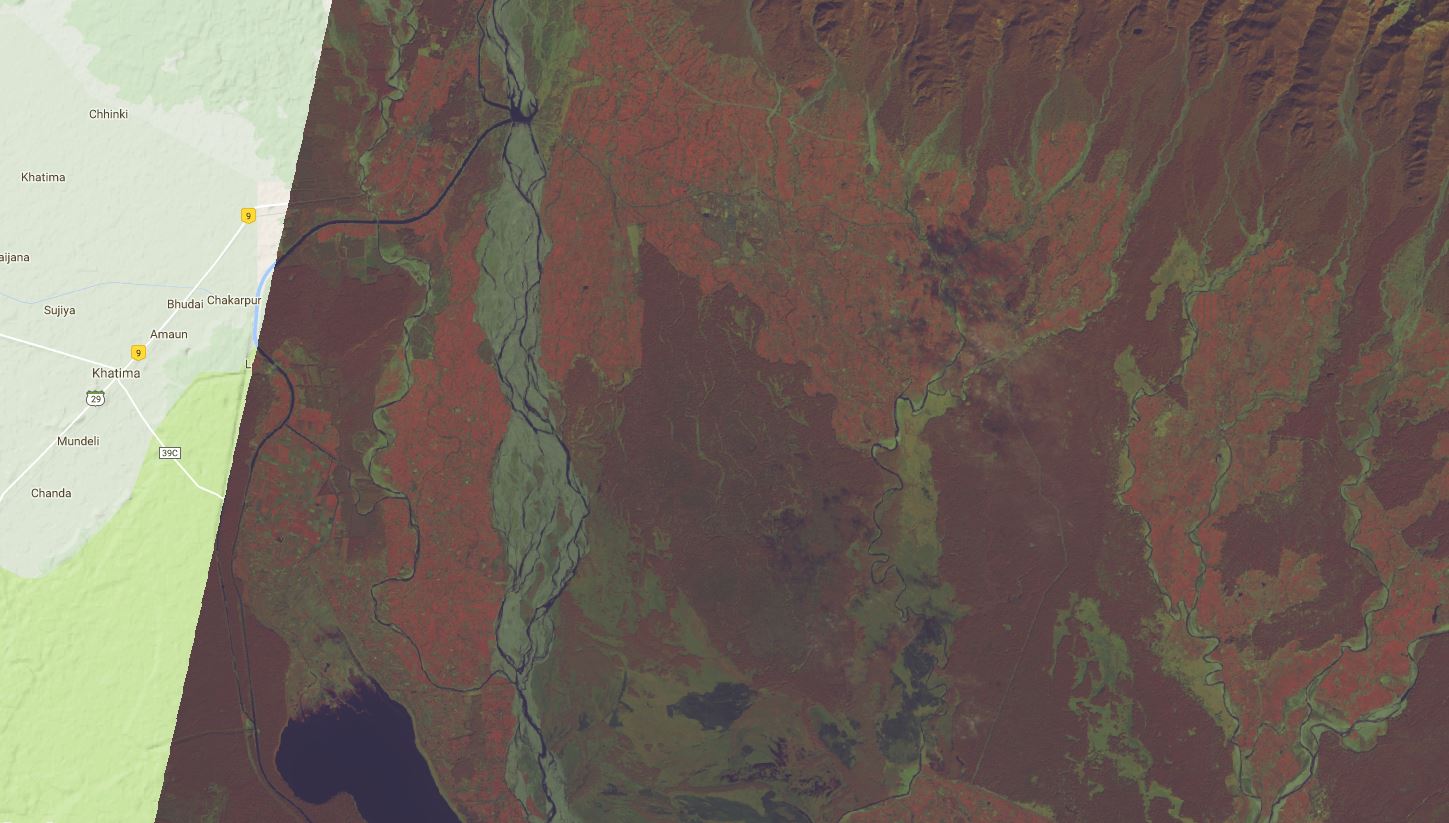
A 5-6-2 image of western Nepal in January, a dry time of the year
Other Landsat Tools
This humble site from the good people at wisconsinview.org is great because it shows the most recent orbital tracks for Landsat 8. This gives you a good view of the polar orbit (Landsat crosses the poles on every orbit) and also for the distortion in the projection at the northern and southern latitudes. You can see the fattening of the images around Canada and Antarctica. Right-clicking on a scene presents some raw data and also two options for downloading—one on the EarthExplorer site and another on Amazon Web Services. Check it out!
Landsat Live from Mapbox is a viewer that shows Landsat images tiled across the earth with helpful attribute data for each image. Here is a look at a scene from Dubai.
Another commercial option is Google Earth Engine, which has an impressive set of processed imagery, like changes in vegetation health. It also includes a scripting editor that allows you to automate workflows within a remote sensing workspace.
There are a lot of new exciting satellite programs just now getting off the ground. But Landsat has always been there for you to lean on, as Bill Withers would say. We hope this piques your interest in Landsat and helps you see how easy it is to start using the imagery to advance your project’s work.