Let us know what type of content you'd like to see more of. Fill out our three question survey.
GIS Toolkit Overview Part I: Remote Sensing
This post is one of a series of posts on Remote Sensing.
May 9, 2019
Geographic information systems (GIS) are often misunderstood, or unknown to many. Even in the development community, we often have a shallow understanding of the technology once we delve into methodologies or use cases—particularly with satellite imagery, or more aptly, remotely sensed data. GIS and remote sensing are not synonymous, but scientifically and inextricably linked. When choosing a GIS/remote sensing methodology or technical analysis component for a project, it is important to understand the strengths and shortcomings of the available tools.
GIS image developed by the author when he was working for the Amazon Conservation Association.
For this article, GIS and remote sensing are, respectively (and respectfully), over-simplified such that the former tends to focus more on spatial analysis and cartography, while the latter on the realm of collecting data about the environment from remote vehicles. In Part 1, I will focus on the remote sensing of Earth (which we can feed into a GIS and analyze later).
Remote sensing can be used to support research in far too many fields to list here (but to name a few—satellites allow scientists and analysts to track deforestation or illegal mining on a near daily basis, analyze dissolved solids in lakes and oceans, discern atmospheric particulate matter, identify soil composition, estimate crop health and yield, track global temperatures and sea ice extent, and allow for more complex statistical analysis of the coincidence of seemingly unrelated datasets, including economic and demographic, with these geographic data.)
A quick internet search will quickly show you how this list barely scratches the surface, but it also provides an overview of the breadth of areas where remote sensing plays a major and fundamental role.
One Size Never Fits All
At this point you may think remote sensing is only spaced-based, but before we had space-borne vehicles, we had airplanes, and before we had airplanes we had drones. Wait. Or is it the other way around?
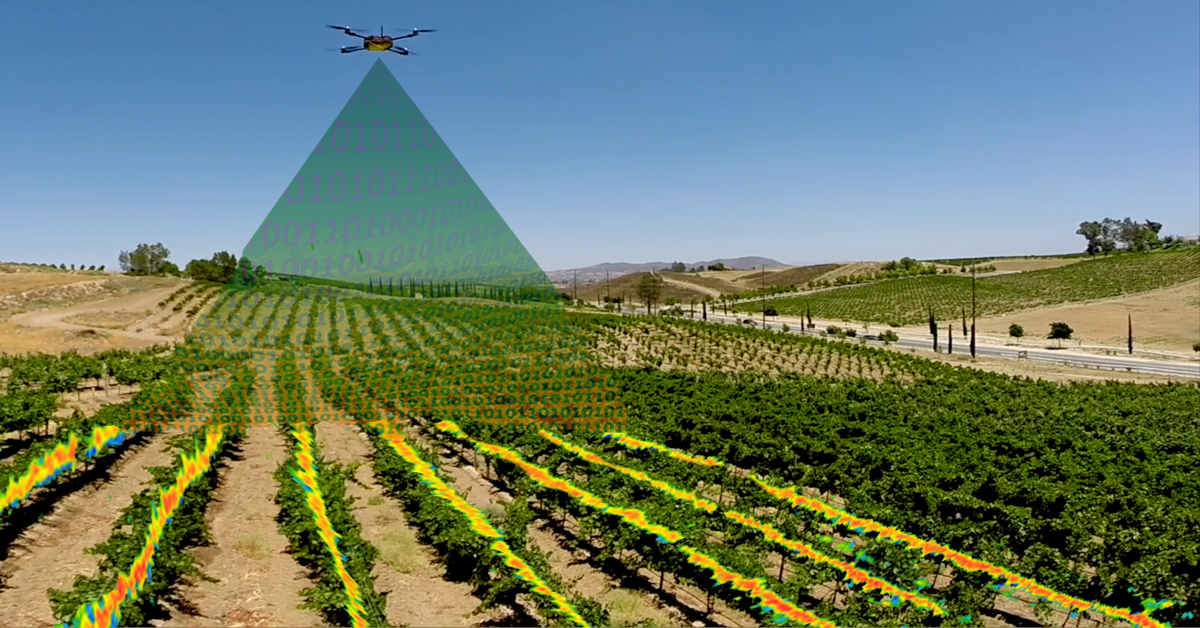
Image from Aerial Services Inc.
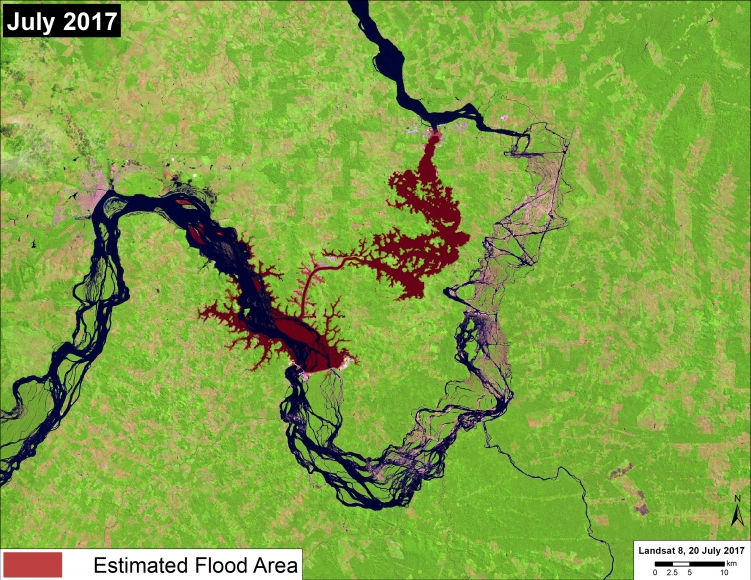
Drones (or unmanned aerial vehicles) are the newest entrant into remote sensing our environment. With the increase in quality of drone and camera technology, we can not only achieve fantastic cinematic flyover scenes, but we can also capture incredibly high-resolution imagery of agricultural fields or flooded areas inaccessible by larger manned vehicles. Using drones allows for hyper-specific, high-resolution analysis of a small area, but they can be be expensive.
Aerial photography can cover wider areas at a comparative high resolution, but it is also expensive to hire a crew and fly a plane over areas of interest, especially remote areas. Regardless, this data can be very useful in tandem with other lower spatially but higher temporally resolute image capture methods. For tracking expansion of plantations for example, this data could be used to highlight a particular point in time to verify the edges of tree lines as compared to satellite imagery.
Images captured from the multitude of satellites (multispectral or photographic) orbiting our planet are currently the most ubiquitous data sources for remote sensing of our environment. Resolution runs from ~30 centimeters to multi-kilometer. But with higher resolutions often come fewer overpasses, so data may not be as frequently available as with lower resolution data.
Radar imagery is much more difficult to process, but is immune to cloud cover. This enables the more immediate comparison of daily or weekly images as the satellites passes over the area of interest. For example, I have used radar imagery from NASA to track the rapid expansion of logging roads in the Amazon rainforest. This would have been much more difficult or impossible to track at a high rate due to cloud cover preventing capture of visual spectrum information.
Using Remote Sensing to Help Answer Other Questions
Demographics, socioeconomic indicators, and other satellite-unrelated data are oft forgotten when it comes to answering research questions with spatial technologies. Subnational data can be further rasterized (creating a grid or cell-based dataset from continuous data). Think digitization of analog signals. For instance, an analyst can spatially overlay a grid on several datasets that have a spatial component and combine them such that each grid cell aggregates all data that falls within its bounds. This new dataset could include data for number of conflict events, population, economic output, elevation, average temperature, ethnicity percentages, crop health, or nighttime light brightness. When appropriately aggregated, these data can be statistically analyzed and offer new insights.
Remote sensing has such wide-ranging applications that most likely there is a spatial component that can be addressed by using remote sensed data across international development initiatives. For example, if you’re working on an agriculture project and asking: “Where should I plant more trees or focus forest conservation efforts?” Remote sensed data can help provide insights into where forest loss is occurring.
Remote sensing and GIS are not the hammer for all nails, but it is good practice to consider if using spatial methodologies can add value to your project before getting too far into implementation. You want to avoid thinking, “Oops, I wish I had collected and mapped this data!”
Stay tuned for Part 2 that will discuss basic GIS tools used to answer your spatial questions.