Let us know what type of content you'd like to see more of. Fill out our three question survey.
GIS Data: Availability and Applicability, Part 1
This post is one of a series of posts on Remote Sensing.
Nov 11, 2021
It is an understatement to say that data are often imperfect. There are often holes, missing pieces that always seem to be precisely the required piece to cement the foundation of your carefully crafted research question. The process of massaging that research question will not be covered here, but data exploration is pivotal in discovering what is available and what is applicable, especially so when it comes to the spatial components of datasets. Hopefully, the following information will help you in the future when looking for data or deciding which spatial data to use to augment or drive your research.
What is Spatial Data?
Let’s talk about which types of data qualify as “spatial.” Nearly all of it—as long as it has some location information attached (GPS coordinates, street address, country, district)! Physical objects, places, or buildings, or singular events like concerts, protests, or fires can all be considered spatial because they occur at or are defined by their location on earth. Things exist in the world, thus have a location. The catch is that location data must be captured or collected, and included along with other relevant information about the building, object, event, or city, as adding it later presents another set of challenges. It may seem obvious, but a spreadsheet of election results is not spatially useful if polling station names or locations are not included. We would want to know where specific election results are located to gain any insights.
Types of Spatial Data
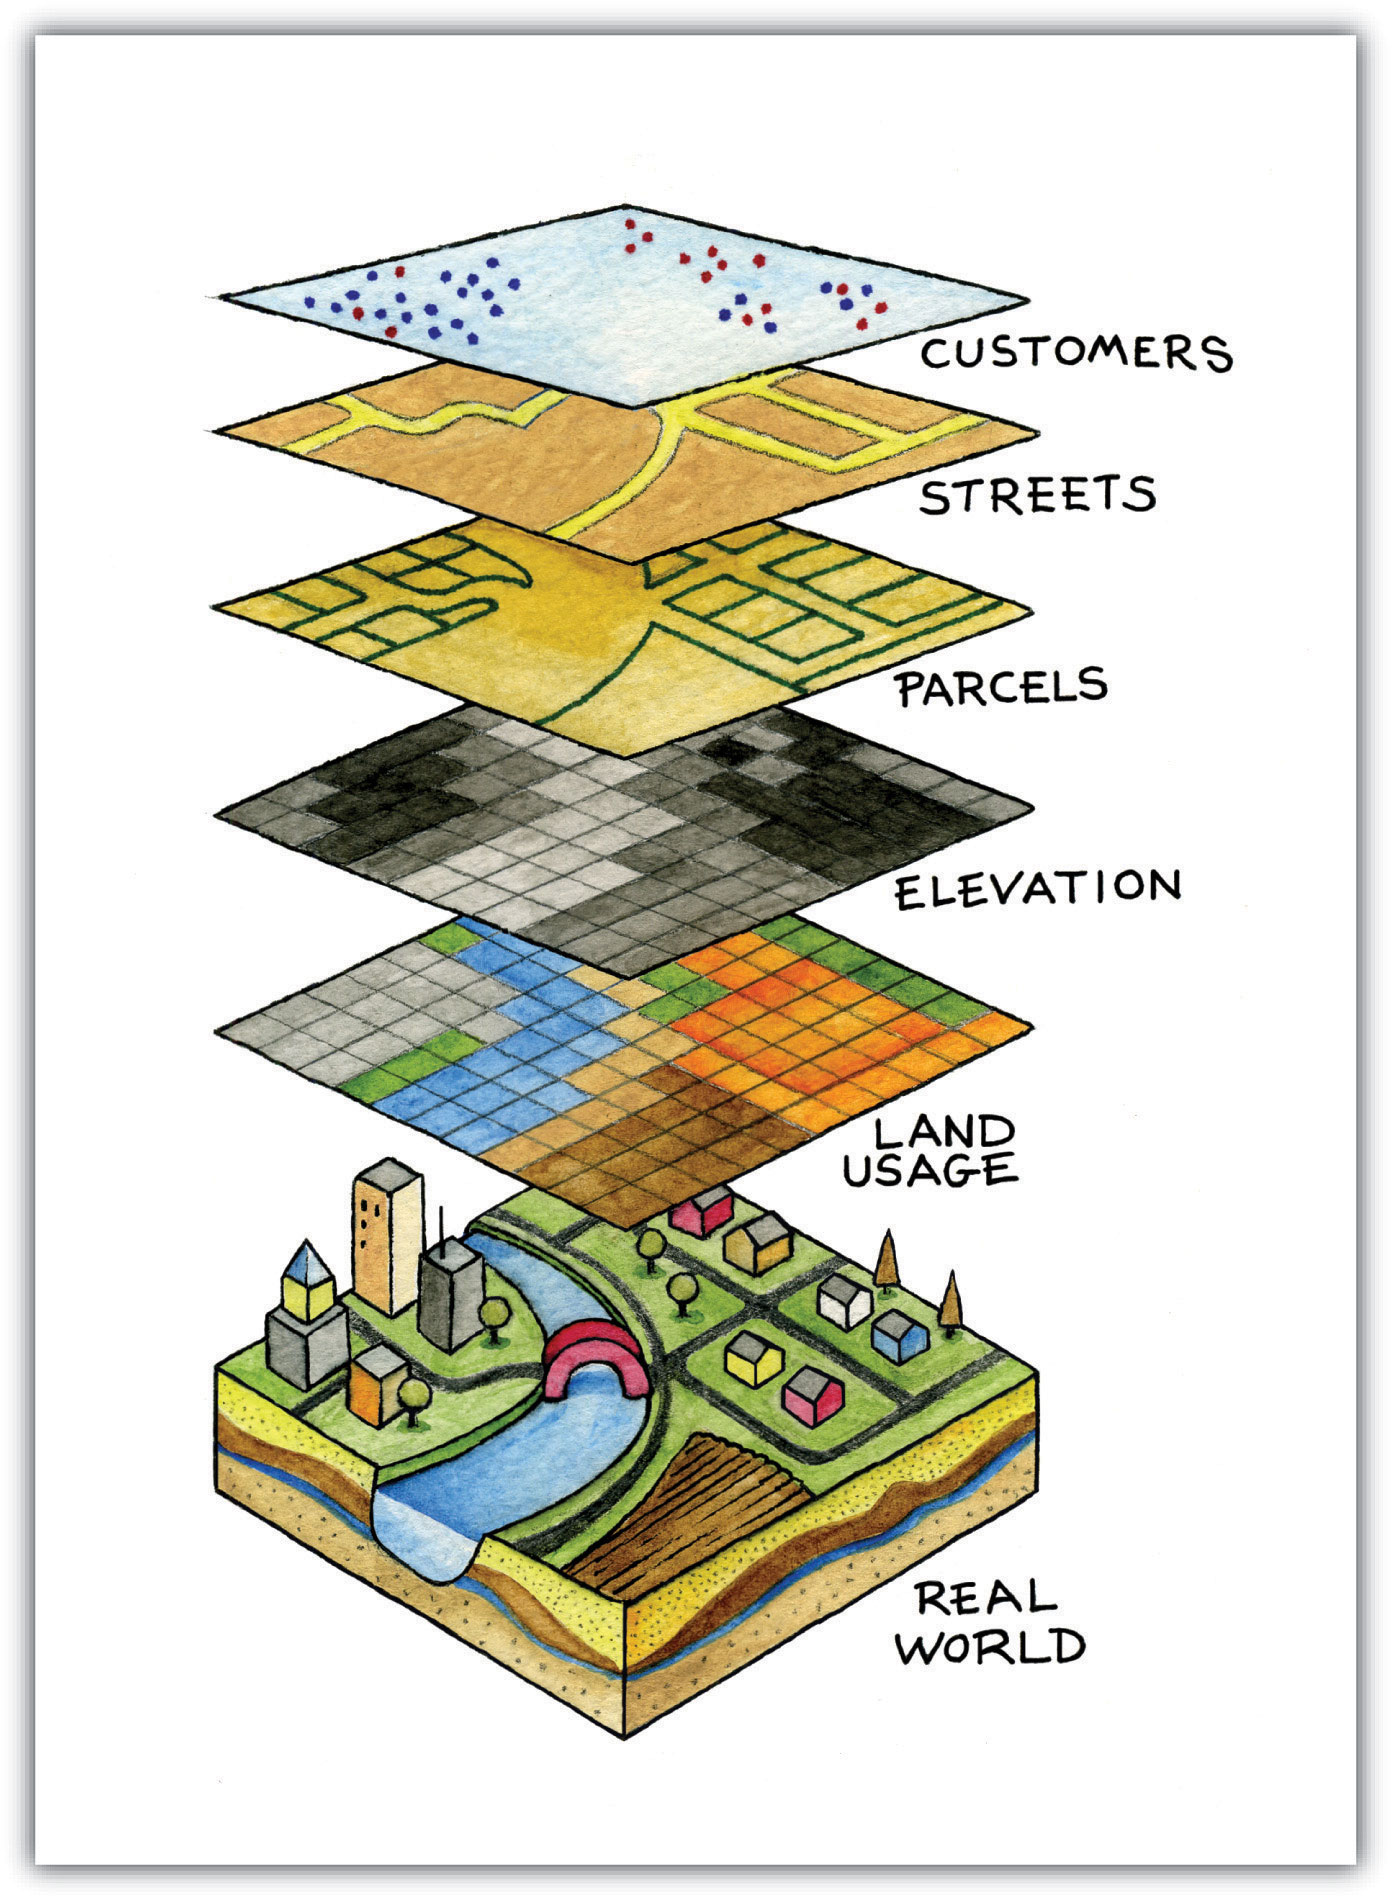
For the scope of this article, spatial data comes mainly in three types: points, polygons, and imagery (sometimes called rasters, but this is a much broader category for another time).
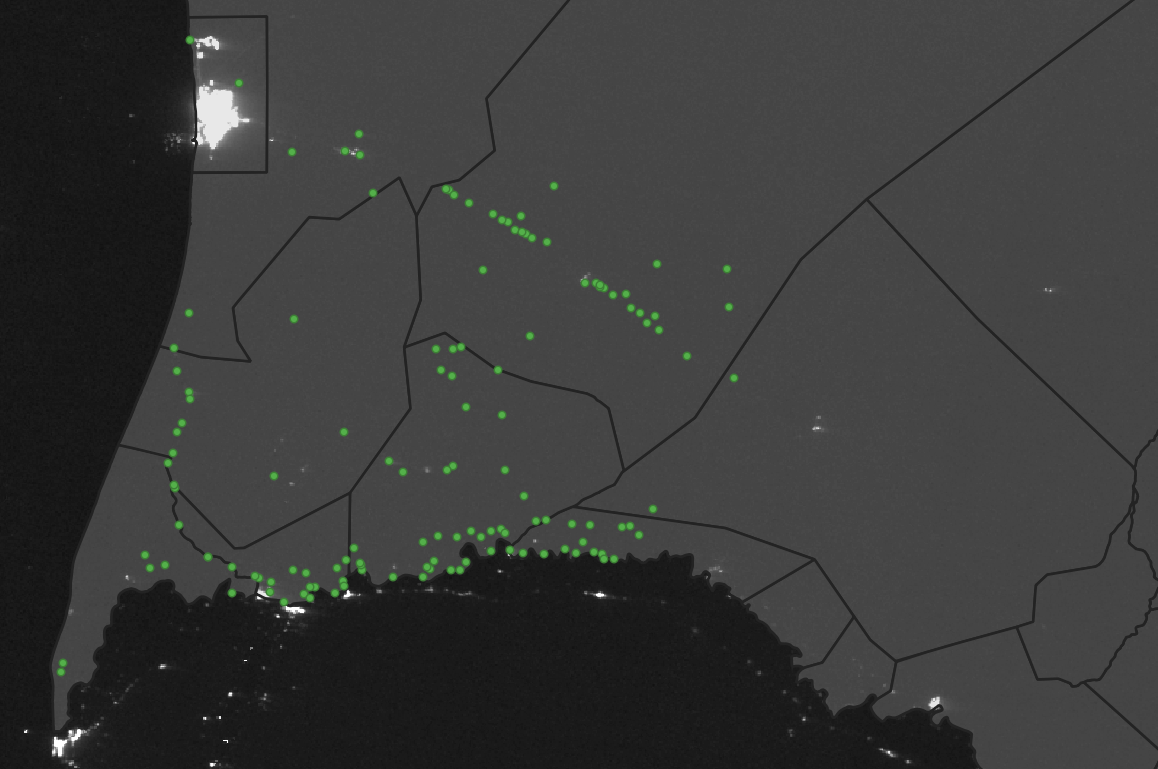
Points can be thought of as fixed points on the globe, defined using latitude and longitude coordinates. This data type is often referred to as GPS coordinates and can be collected using specialized equipment or even a smartphone. The point type applies to data such as tweets, conflict events, temperature sensor locations throughout a state or county, or anything with a fixed location.
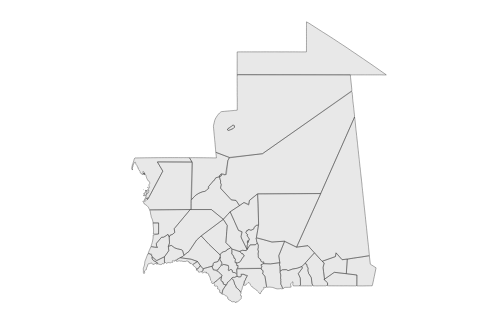
A polygon is a multi-sided shape—a square and rectangle both count—but usually an irregular shape like the boundary or a protected natural resource area. The key here is that it has a defined area and can be used to calculate an amount of something of interest inside (or outside) the bounds of the polygon. An excellent example of this would be the border of a country. It is often irregularly shaped but encloses the territory of a sovereign nation.
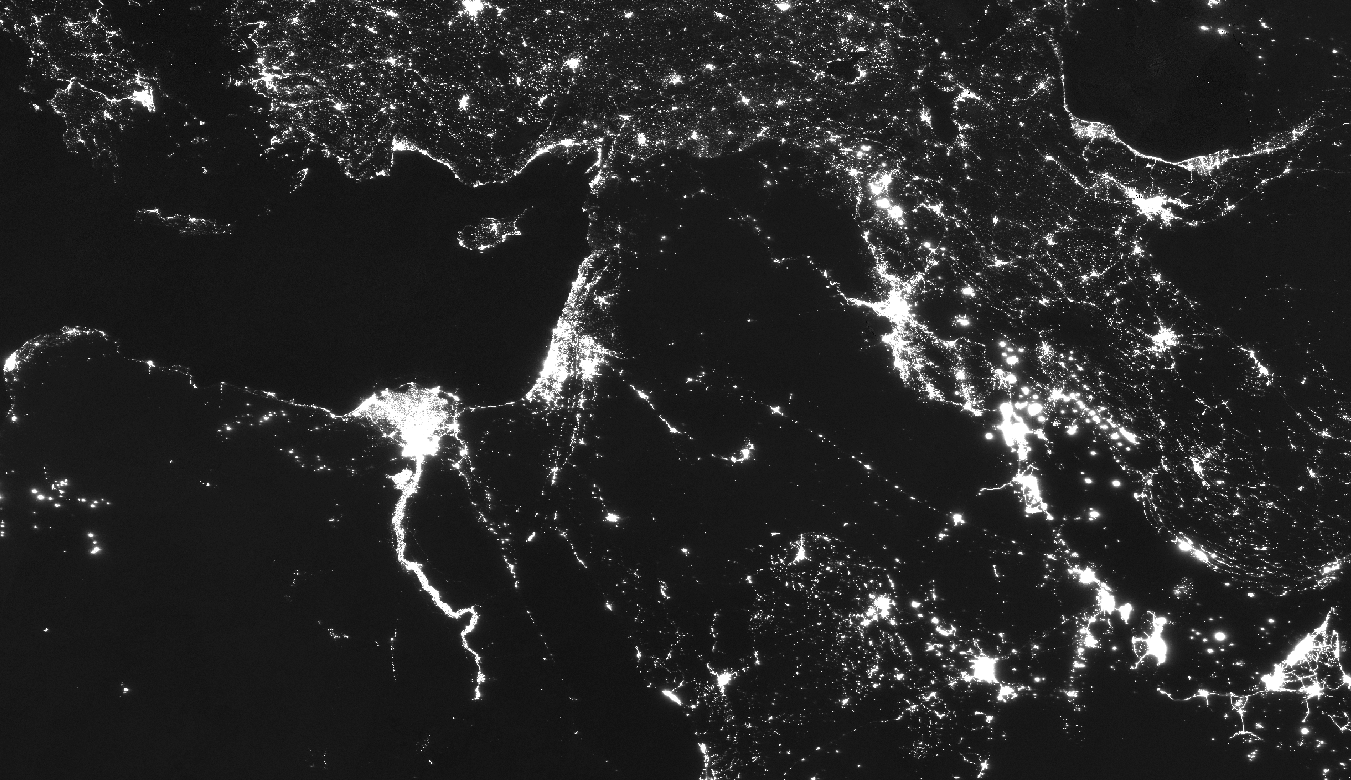
Night light intensity satellite imagery.
The third general data type is called a “raster” and is conceptualized at a high level as “imagery.” A raster is a collection of pixels (similar to a .jpeg), or small digital squares, that have a defined location value, as well as any number of other values assigned to it. Satellite imagery is just this, a picture taken from satellites whose pixels are assigned values that make up an image. This imagery can be used easily for change detection to make assertions such as “there was a forest here before, but now the forest cover is gone, and there is a palm oil plantation in its place.” Or “there was water here, and now it is has grown in size to an area of XYZ square kilometers, likely because of the new dam constructed last year.”
Know What Data Exists and What is in Your Data
It is essential to deeply understand the question you are trying to answer so you know what data might be relevant.
If your research question is “How much forest cover exists inside protected areas in Malawi?”, a good starting point would be to look for forest cover data from the appropriate time frame(s) [satellite imagery at sufficient resolution], the administrative boundaries of Malawi [polygons], and the boundaries of any protected areas of interest [polygon]. The locations of major nearby cities points might also be of interest and valuable in case proximity to large cities is suggested to be a factor for decreased forest cover over time.
The downside of some satellite imagery is available resolution, both spatial and temporal. There might not be enough detail in the image to answer your research question, or the satellite may not fly over with enough frequency to make data available. Suppose your research is focused on a particular country whose area is not particularly well-mapped or not updated often. In that case, there may not be up-to-date polygon (area) information on the size and location of protected areas, especially if the local government is not keen on maintaining the site.
Questions to “ask of your data” might include:
“What year or years does the available data cover?”
“Is it complete for the study area?”
“For elections polling stations, are all of the polling stations represented in the data to give a holistic view of the results?”
“Is this data accurate, and can I trust the source enough to base my conclusions and decisions on it?”
These are all critical questions to pose to your data to make sure it fits your needs or that any analyst supporting your work knows what to expect from your data or when supporting your data exploration. Data sources often come with caveats noted for the data regarding missing years (if time-series) or missing locations due to extreme circumstances or equipment failure (e.g., weather sensors).
I Cannot Find any Applicable Data! What Do I Do Now?
Sometimes during the exploratory phase of the research question (hopefully not after), you might find not enough data to support the work. While you could certainly pivot the scope of research, depending on the type of research, it is possible to create your data! While this can likely be expensive, painstaking, and time-consuming, it might be just what your project needs (and/or easier than you might think initially), and the global community of geographers and data scientists will always welcome new and clean, informative data. Your research and analysis will benefit. While creating your new satellite imagery will be challenging, to say the least, you can create your data by digitizing hand-drawn or printed maps or collecting GPS coordinates for field boundaries or farm locations, and add them to a geographic information system to process and create new, valuable information out of thin air.
The excellent news is geographic data is becoming more available and getting better over time as more organizations and countries realize the benefits of up-to-date spatial information on a global scale and strive to maintain better, cleaner data.