Let us know what type of content you'd like to see more of. Fill out our three question survey.
Getting Subnational: Combining Large Scale Surveys with Geospatial Data to Produce Better Small Area Estimation, Part I
Apr 7, 2022
Collecting granular location data on key socioeconomic indicators for strategic planning is an increasingly important topic in international development. Given the limitations of national-level data, many analysts and policymakers now focus on obtaining subnational data to identify pockets of poverty in a country, select priority sites for poverty alleviation programs, establish subnational benchmarks for monitoring and evaluation purposes, and cross-validate data collected by country governments on indicators such as child mortality and basic literacy rates.

The ambitious standards set for the Sustainable Development Goals were intended to be accompanied by a “data revolution” in low and middle-income countries that would produce high-quality subnational data. This data has not been generated by central statistical agencies collecting greater quantities of administrative data, as previously thought, but rather through methodological and technological advances in small area estimation (SAE) methods. Using these models has become a viable option through big data techniques, such as Bayesian multilevel statistical models that require heavier computation, and wider availability of other forms of data that can be linked to surveys, such as geospatial and social media data. As a result, large-scale surveys—such as the Demographic and Health Survey, Multiple Indicator Cluster Survey, and Living Standards Measurement Survey—have used these analytical techniques to provide key socioeconomic indicators at more granular levels.

This article provides an overview of SAE methods and their advances. Part I highlights progress made in survey data analysis to produce more precise subnational estimates. We detail the initial use of SAE methods in poverty mapping at the World Bank and their increased relevance to other areas, such as public opinion and polling research. Building on our prior posts on the innovative uses of GIS data, Part 2 focuses on the promises and challenges of linking socioeconomic and geospatial data for subnational estimation.
A later article will showcase how the Center for Digital Acceleration (CDA) team has employed SAE methods in our own work to inform strategy and draw insights.
Advances in Survey Research and SAE Methods
SAE refers to a set of statistical methods used to make more accurate indirect estimates when a survey’s subsample size is not large enough to produce precise direct estimates for the regional areas under examination. These techniques use statistical models that link survey data to larger datasets, such as administrative or census data, from which they borrow common variables to “fill in the blanks” on a variable of interest for the area in question.
SAE methods have been in use for more than 40 years, although their principal use in the international development space began with the World Bank’s poverty mapping (based on the ELL model) in the early 2000s. This approach typically employs a two-level (survey cluster and household) nested error regression model to estimate income or expenditure at the household level using survey data. These estimates are then linked to create predicted values at the household level for all census tracts, using the same set of covariates that were applied in the regression model. Finally, the estimates are aggregated upwards to the relevant political or administrative level units for analysis.
The success of this method led to the development of the PovMap software, which provides subnational poverty estimates to analysts, policymakers, and other practitioners. The World Bank also began offering training and support to statistical agencies to expand the use of this method.
Methodological advances in statistical modeling, particularly the development of the MR model—which conditions on the survey sample data to produce simulated estimates of welfare—has made estimates even more precise. Such methods are increasingly used to assess indicators beyond poverty and welfare, including health outcomes, employment rates, and public opinion-related questions. Survey researchers and political scientists have used multi-level regression with poststratification (MRP)—another multilevel modeling method—to evaluate public opinion and even to forecast elections. Most notably, the polling firm YouGov used the method to accurately predict the result in 93 percent of all constituencies in the 2017 U.K. parliamentary elections.
These developments have enabled one particularly important achievement for survey researchers: a shift to less expensive data collection modes, such as online survey panels or SMS messages. Researchers can collect a larger number of responses and correct non-representative samples through the use of poststratification based on information available in the auxiliary data. A prime example of this is the accurate prediction of state-level outcomes in the United States for the 2016 national election by asking X-Box users who they planned to vote for.
These methods have now entered the international development realm. Most recently, the Bill & Melinda Gates Foundation, Mathematica, and Geopoll carried out an SMS survey in Uganda to estimate financial inclusion using a version of MRP.
The Promises of Linking Geospatial and Socioeconomic Data for Small Area Estimation
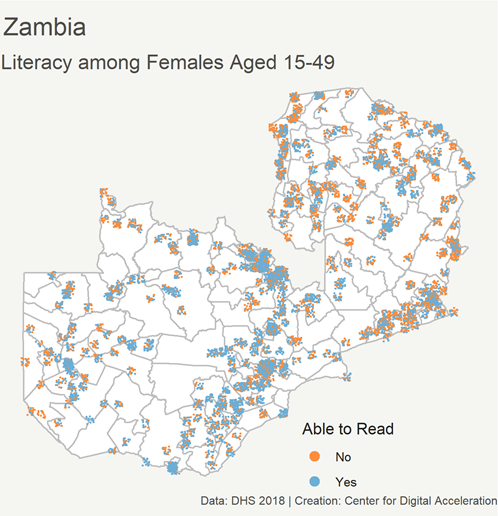
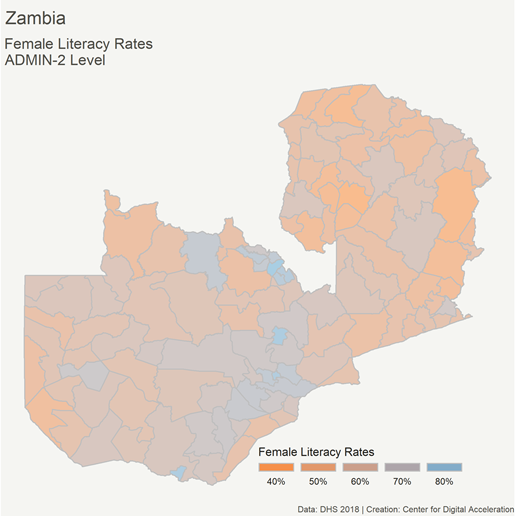
Another important advance has come from linking geospatial data with household surveys to improve the prediction of estimates. Examples of geospatial data include the use of environmental factors, such as total rainfall per year or average monthly temperatures, agricultural variables such as growing season length, or infrastructure-based information such as nightlight intensity. The potential for using this information is massive, particularly to fill information gaps in countries that do not conduct frequent large-scale surveys or censuses, as is the case in many low and middle-income countries (see Table 1), particularly fragile states.

Table 1: Most Recent Year of DHS Standard or MIS Survey
Does geospatial data provide useful information for SMEs? So far, the U.S. Agency for International Development (USAID)’s Demographic and Health Surveys have accumulated a large evidence base by linking key geospatial information to enumeration areas for their surveys. In addition, USAID has produced a significant body of research reports on the incorporation of geospatial information to foresee various socioeconomic and health outcomes.