From Data to Knowledge: Applying Schema Agnostic Systems Modeling to Development Challenges
Sep 22, 2016
By now the much-vaunted “Big Data Revolution” that technologists have endlessly touted is in full swing. Almost all industrial and economic sectors are actively recognizing and harnessing the potential of digital data. International development is no different, as an ever-increasing number of programs are being conceived with data for decision-making as a central pillar to improve intervention strategy, activity coordination, and impact measurement.
There is little doubt about the value of many of the information systems being used to gather and transform data to provide valuable information—from health information systems such as District Health Information Software (DHIS2) to mobile data collection platforms such as Open Data Kit (ODK). But while these platforms have helped us to effectively automate the collection of data and its transformation into actionable insights, few systems address the question of how we might digitize and integrate actual expert knowledge into a system to further automate knowledge-based workflows. To better understand what this means, it is useful to know the Data, Information, Knowledge, and Wisdom Pyramid for data value extraction. The question at hand is: How can international development practitioners move from generating and collecting data and information to actually capturing knowledge—a human understanding of how complex systems work?
To explore this question, I recently contacted some old friends from Soley GmbH, a data analytics startup that specializes in just that—integrating expert knowledge into digital systems to automate resource-intensive workflows, and master complexity. Together we tried to come up with a use case that could demonstrate how their nifty modeling and simulation platform could help us understand how we might optimize farmer crop production in certain regions in Ethiopia to maximize farmer incomes. This was done by simulating a virtual crop marketplace in Ethiopia based on past market price and and localized climate data. The results were a set of recommendations for optimized crop production strategies for individual farmers in the market that would ensure farmers could maximize incomes in coming years just by planting an optimal combination of crops.
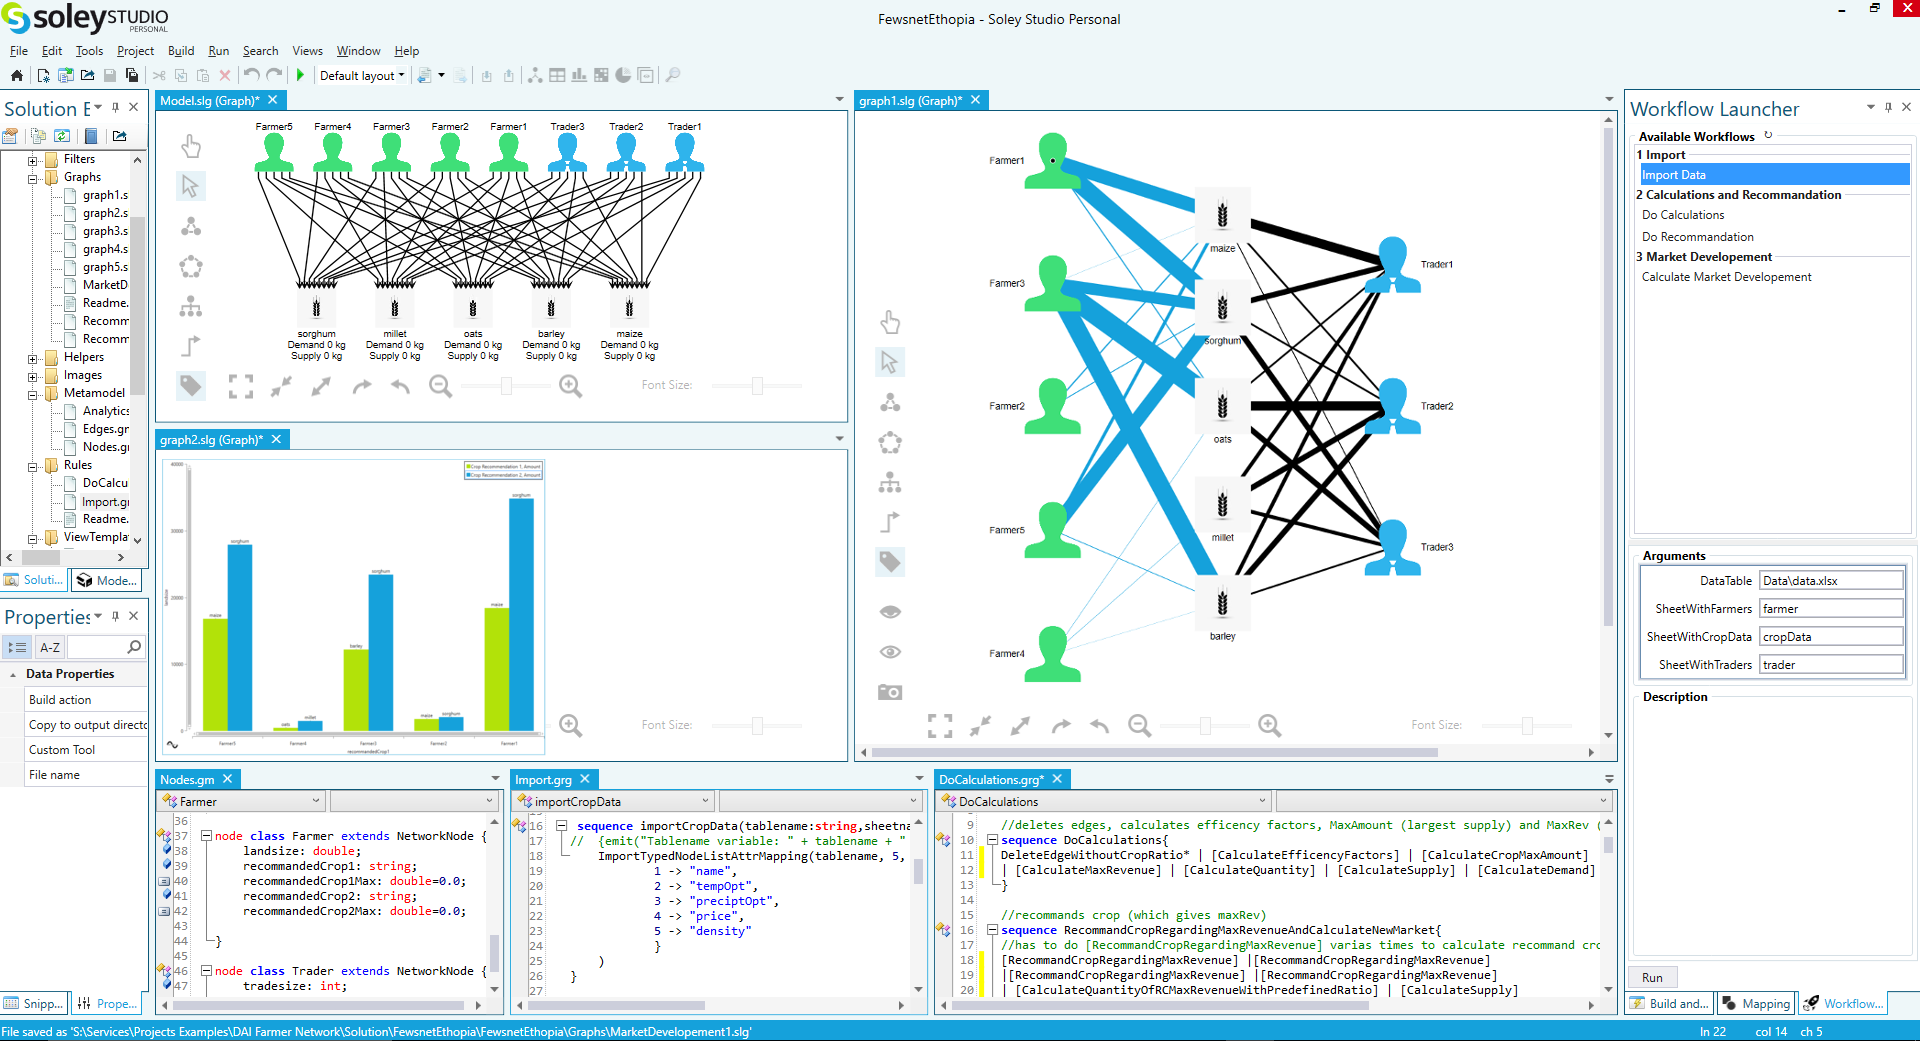
Figure 1: A Virtual Crop Marketplace Model and Simulation in Soley Studio
The Process
Let us pick pick apart how the good folks at Soley set up the model and came up with the optimal crop planting strategies for farmers. The first step was to create a so-called meta-model (sometimes referred to as an ontology or a schema) describing all the elements in the system and their interactions, specific to our use case.
Every meta-model contains a set of basic building blocks classified as either nodes or edges.
- Nodes - are entities within the model that often represent physical actors, goods, or services. In our model, nodes include:
- Farmers
- Crops
- Traders
- Edges - are the relationships that define how entities (or nodes) in the model interact with one another. In our model, edges include:
- “Sells”
- “Buys”
- “are Competitors”
Once a meta-model has been created, data from a variety of sources can be overlaid and mapped to the meta-model. The meta-model is dataset agnostic, meaning that any different datasets (from different countries for example) can be mapped to the same model. Elements and their relations can be queried as patterns (for example: farmer » sells » barley) so that the meta-model and the data sets are combined to create an actual working model. This intuitive approach is how an agent-based crop market was modeled.
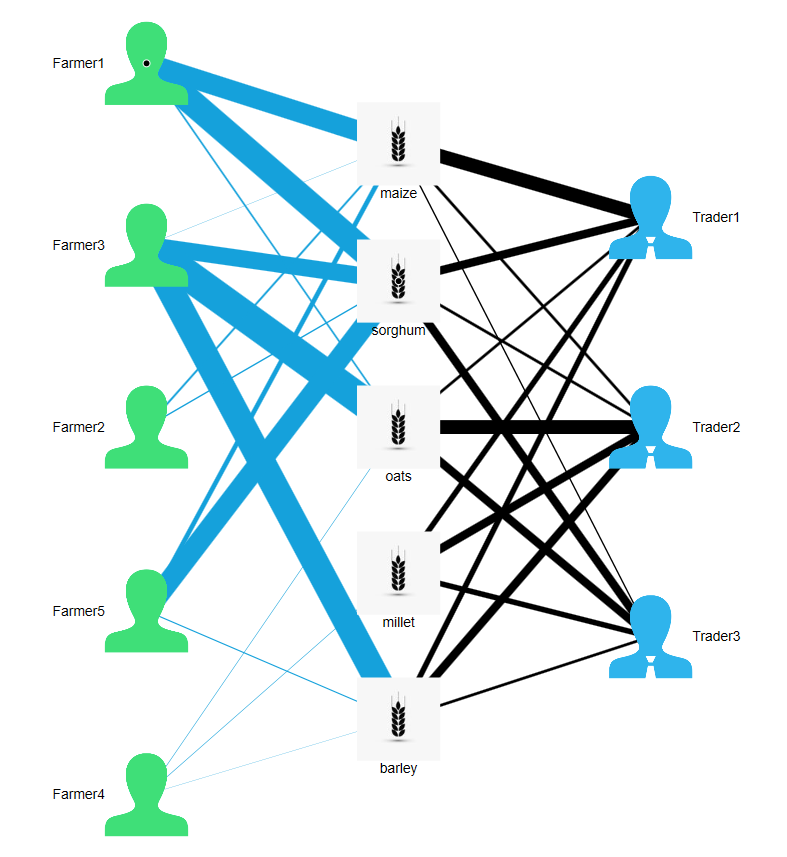
A graphical representation of a model that includes nodes (farmers, crops, and traders) and edges (quantities of commodities sold and bought by farmer and traders respectively).
Finally—and perhaps most critically—the model includes a set and sequence of so-called “rules.” Defining rules allows for knowledgeable experts to integrate human understanding of complex subject matter that has been acquired through study and experience into the model. A simple example of such a rule could be that farmers aim to maximize profits by maximizing sales given specific commodity prices. But if this were the only rule encoded into the model, all farmers would simply produce a single crop—the crop with the highest market price—effectively leading to the depression of the market price, incurring greater farmer risk, and leading to farmers producing low-yield crops. So additional rules governing diversification for risk management (e.g. production of at least two crop varieties), as well as rules linking local climatic conditions (such as rainfall) to crop variety suitability were also encoded into the model. Finally, a rule governing the optimization of the combination of crop is included. These supply-side rules are then linked to demand data based on aggregate sales volumes of the previous year to link the supply side of the market to the demand side and link traders to farmers.
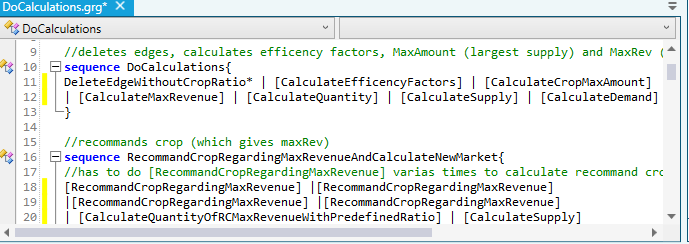
Once rules have been defined, they are combined into sequences to run simulations.
The Result
A market simulation is run based on sequences of rules (as outlined above) to produce a new market scenario in which a group of farmers meet crop demands through an overall harmonization of crop production strategies. The result of the simulation is a set of localized recommendations for farmers for which combination of crops to plant and harvest and at which quantities to optimize efficiency and income based on their local climate and market prices. In this model the suggested ratio of growing the best two crops are set to 80 percent and 20 percent of each farmer’s total amount. The suggestion itself refers to the amount of land that is supposed to be used to grow each crop as this information can be used easier by the farmers. This ratio could of course be adjusted or a third option could be suggested for each farmer to emphasize biological variety in the region.
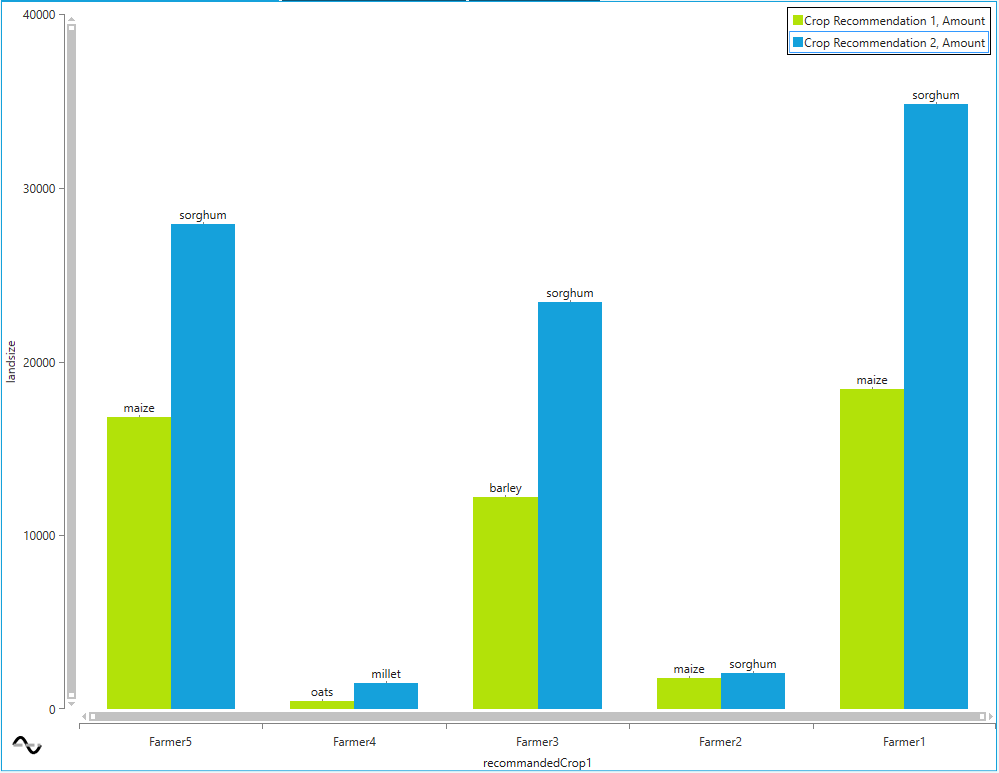
The outcome of the simulation yields a recommendation for crop production based on farm size, climate data, and market demand that is more efficient for farmers.
The simulation of this crop production adjustment on the part of farmers in turn affects future market prices, based upon which the simulation can be iteratively run, until a market-clearing equilibrium is reached. Ultimately, the model reflects the fact that farmers’ incomes depend not only on the size of their land or the market price of the crops they produce, but also environmental conditions such as humidity and altitude. This process of defining a unique combination of drivers enables macro-level modeling of complex systems to yield localized, specific recommendations for crop optimization based on specialized expertise.
This particular model that built by Soley is only a small scale prototype that demonstrates the potential of schema-agnostic data modeling platforms using readily available data and a limited set of expertise-based rules, to provide deep insight into a complex structure. Combining the domain-specific and regional expertise of DAI’s experts with with available data allows us to digitize and institutionalize knowledge so that we can drive best practices and nurture more sustainable and productive futures in agriculture and beyond.
Thanks to our friends at Soley for co-authoring this blog with us! You can check out their suite of tools and more scenarios on their website.