Let us know what type of content you'd like to see more of. Fill out our three question survey.
COVID-19 Data Analysis, Part 6: Insights from Forecasting COVID-19 Transmission Rates In Mexico with Google Mobility Data
This post is one of a series of posts on COVID-19 Data.
Jun 10, 2020
This analysis is Part 6 of a series on COVID-19, with a specific focus on Mexico. The analysis will be updated as we receive additional data and the code for all related analysis will be made available shortly.
For the past two months, COVID-19 has made its way beyond the borders of the United States and into other countries of the Americas, namely the second and third largest countries of the region: Brazil and Mexico. While the United States’ daily incidence of deaths slowly declines, Mexico reported its largest daily incidence yet with 1,092 deaths on June 4.
As the country begins to reopen certain parts of the economy and relaxing social distancing measures, we ask: What is the state of the spread of COVID-19 at the subnational level and which areas are at greatest risk?
Our past articles have focused on scenario forecasting of hospital occupancy rates and the challenges of modeling infection rates in Mexico. In this article, we provide an overview of our statistical model on the infection, death, and reproduction rates at the subnational level. We use a Bayesian hierarchical model developed by the Imperial College COVID-19 Response Team for estimating the rate of transmission at the subnational level in Brazil. It utilizes data on the daily incidence of infected, deaths, and individual movement from the Google Mobility Report.
The link to the full forecast can be found here, along with the complete methodology. The dashboard also includes descriptive statistics on COVID-19 for each state and a summary of our prior analysis on hospital occupancy rates.
1. The current rate of reproduction (R0) is between 1 and 2 for all Mexican states.
The rate of reproduction can be thought of as the expected number of cases directly generated by one case in a population where all individuals are susceptible. A reproduction number below 1 (one case is infecting on average less than one person) means that the virus will not spread. Estimates of the basic reproduction number of coronavirus in the first outbreaks of Wuhan, Italy, South Korea, and other initial epicenters suggest that R0 is between 2 and 3. Given that many of these estimates were done before any social distancing measures had been put in place, they provide a reasonable baseline estimate of COVID-19’s transmission under normal circumstances.
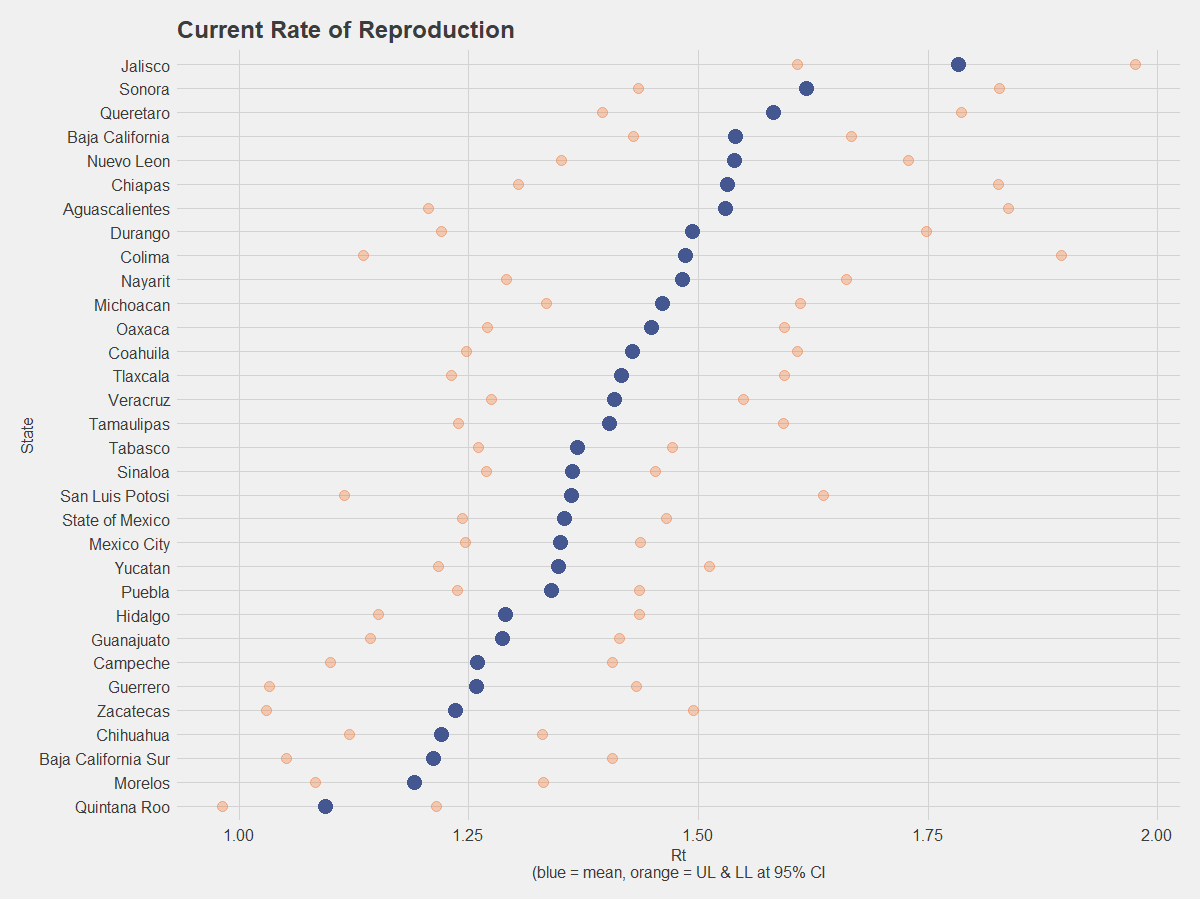
Our model suggests a low degree of variance in the current rate of reproduction across Mexican states: all except Quintana Roo have the upper and lower bounds of their current reproduction rate fall between 1 and 2. While this provides a clear picture on where Mexico stands nationally, there are important differences between the states at the top and bottom of this graph. Much evidence suggests that pushing the reproduction number below 2 can be done with effective social distancing. Thus, stringent adherence to social distancing in states such as Quintana Roo, Morelos, and Baja California Sur will likely lead to elimination of COVID-19 transmission quicker than in Jalisco, Sonora, and Queretaro.
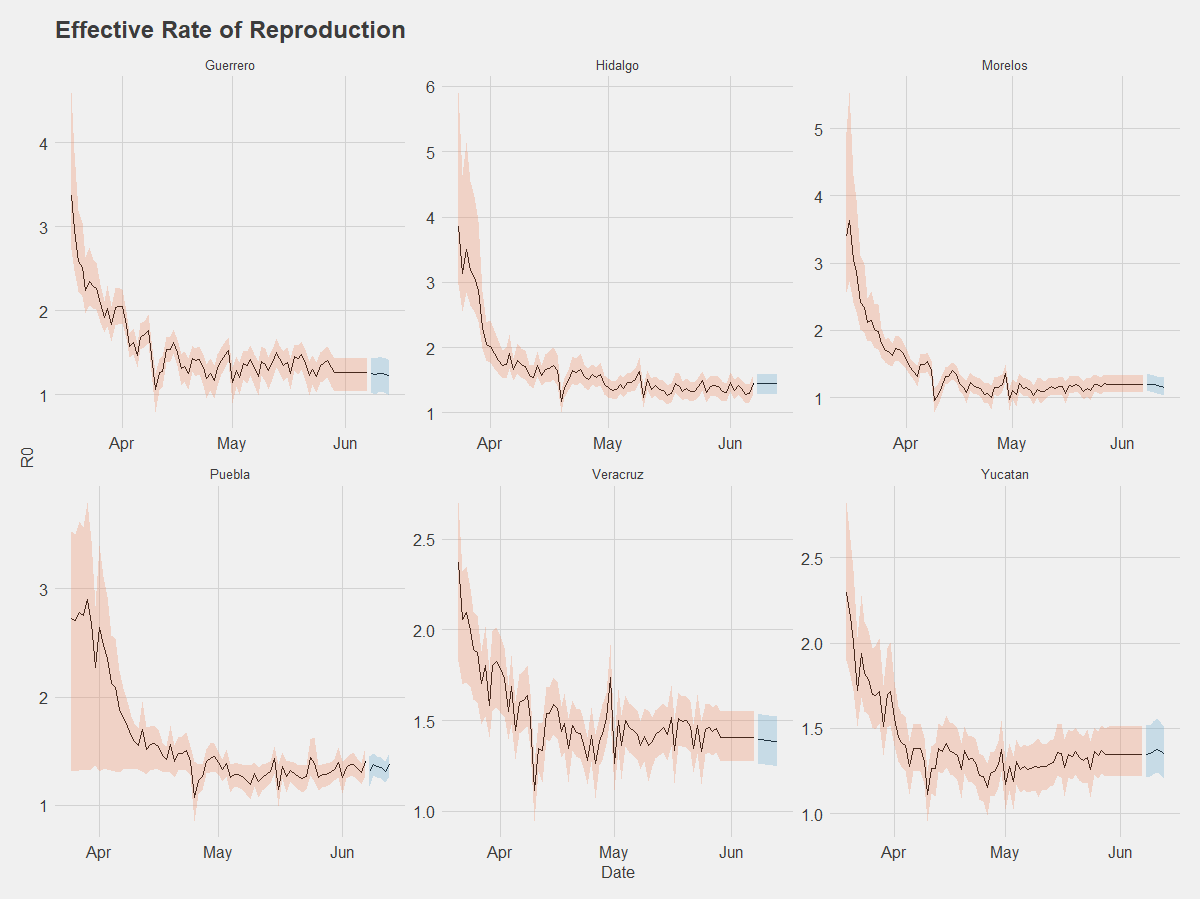
2. The effective rate of reproduction has significantly declined in states with significant initial outbreak.
Observing the trend of the effective rate of reproduction provides important information on how the virus has evolved across time. In Mexico, we observe a similar pattern in the states of Coahuila, Guerrero, Hidalgo, Jalisco, Morelos, Puebla, Quintana Roo, State of Mexico, Sinaloa, Veracruz, Yucatan, and Mexico City, in which the average estimate of R0 was significantly over 2 in mid-April, quickly dropped off in the second half of the month and has slowly declined towards 1 from the month of May to the present. As the graph below shows, these states have managed to mitigate the spread of COVID-19 since then. The data on mobility suggests that this has largely been achieved through effective social distancing and these efforts will have an enormous impact on hospitals in their attempt to manage caseloads. Nevertheless, for these states to effectively eliminate transmission they need to get the rate of reproduction below 1. These states will need to continue encouraging social distancing efforts whenever possible and maximizing caution to push the number below 1.
3. There is not a clear trend for smaller states with more recent outbreaks.
The first insight highlighted a group of states that shared a common trend in their effective rate of reproduction, whereby it began initially high and since has been drastically reduced closer to 1. A second group of 14 states that have not experienced significant outbreaks, including Aguascalientes, Baja California Sur, Chiapas, Colima, Durango, Guanajuato, Nayarit, Nuevo Leon, Oaxaca, Queretaro, San Luis Potosi, Tlaxcala, Tamaulipas, and Zacatecas, display a common pattern in that they lack a large initial rate of transmission and sudden drop-off as social distancing became more common.
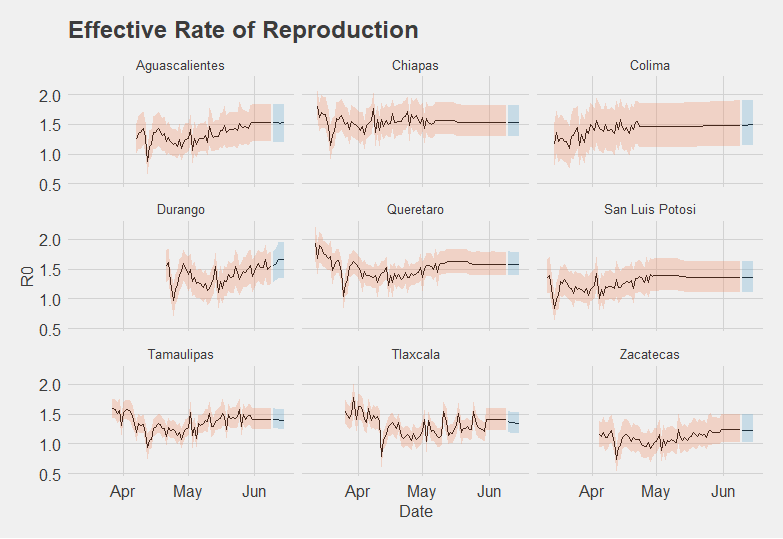
Several of these states are smaller in size and population. This would thus mean fewer aggregation of cases of deaths for the model to accurately read thus far, which could impact its predicting capacity. This may lead to a slower and more gradual spread over time.
The government’s recent plan is to relax social distancing measures in 300 “municipalities of hope” on June 1, many of which happen to be located in these states. While the model suggests that COVID-19 is growing in all these states, the fact that they all have R0 greater than 1, along with the lack of a decreasing trend, should give cause for concern. Furthermore, many of these states have not seen a drastic decline in social mobility when compared to the other group outlines, thus making it even more crucial that officials emphasize the importance of appropriate measures such as mask wearing and maintaining a distance of two meters where possible.
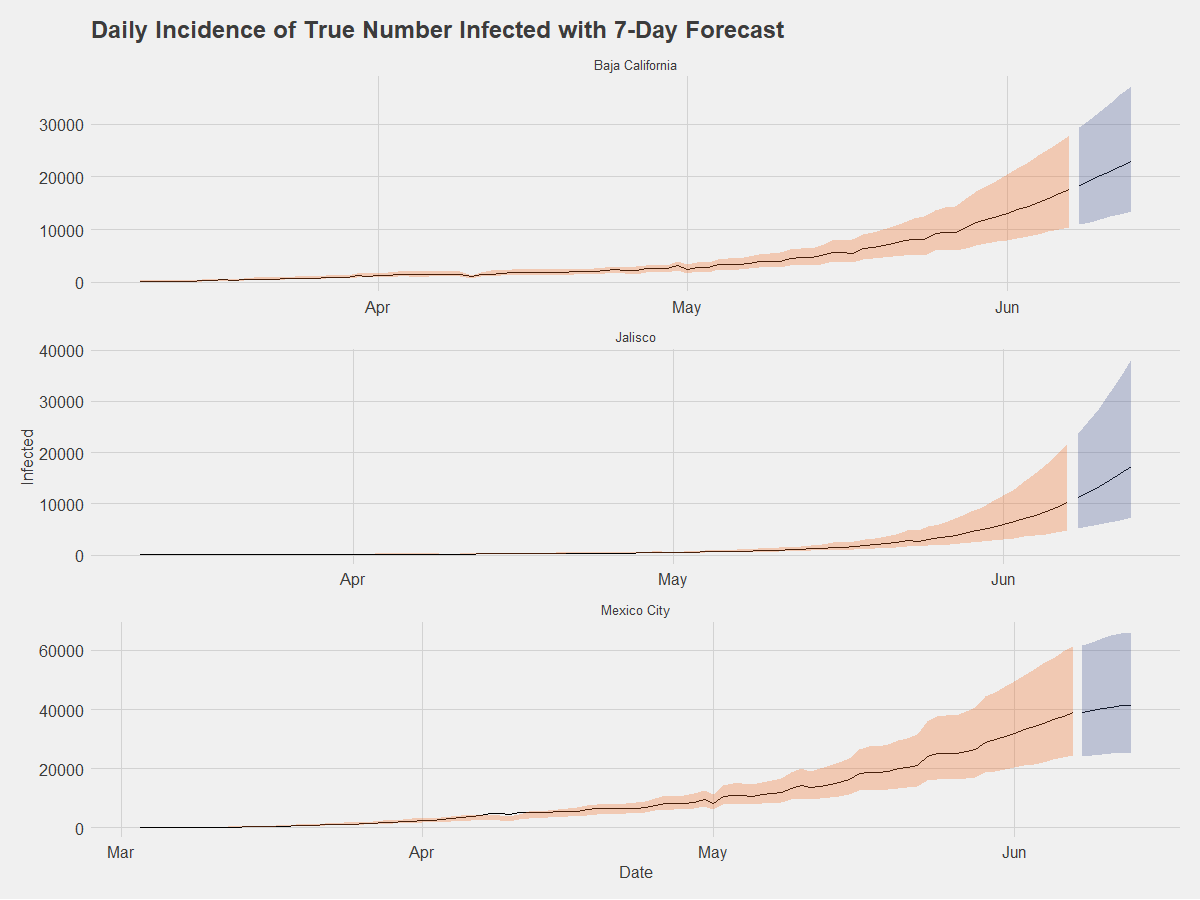
4. There is evidence that Mexico City is flattening the curve. Other states with large cities are not there yet.
The first reported cases in the country were in Mexico City and Sinaloa in late February, although the former has faced a far more significant outbreak, largely due to its metropolis status and being Mexico’s main travel hub. Currently, Mexico City is experiencing its highest numbers of deaths and reported infections: As of June 7, there have been 3,729 total deaths and 37,278 reported infections. However, the silver lining for Mexico City is that our model estimates that it will be reaching its peak soon.
Other states with large cities are at greater risk. The graph below displays the true daily incidence of the number of infected in Mexico City, Baja California, and Jalisco. This is modeled by working backwards from death counts to infer the true number of infected (the full methodology is available in the dashboard). Baja California, where Tijuana, the fifth largest city is, is expected to have an R0 of 1.54. The situation is even worse in Jalisco, where the third-largest city Guadalajara is. Our model predicts that transmission is increasing in this state.
What explains this difference? There are a few reasons. First, the outbreak in Mexico City began earlier than anywhere else in the country. In this sense, the data indicates that the city is one to three weeks ahead of other cities and regions, which means that they will peak sooner. The other factor influencing this deviation is that social distancing has been more strictly adhered to in Mexico City. The Google Mobility Report, which the forecasting model uses to predict future rates, tracks community movement by mobile phone. It categorizes these movements around six key types of areas: residential; grocery and pharmacy; transit stations; parks; retail and recreation; and workplaces.
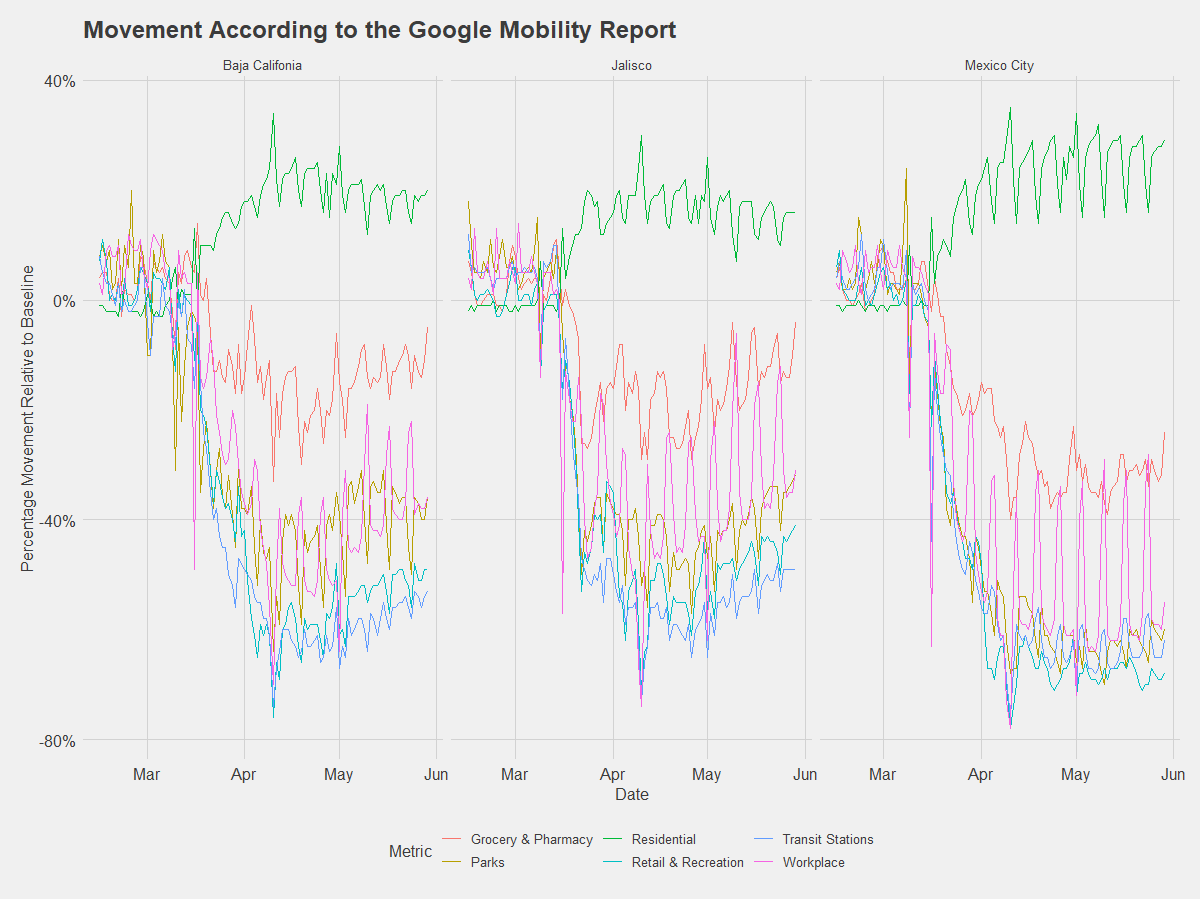
The graph above suggests Jalisco and Baja California have seen increases in mobility, while Mexico City’s rate across all types of mobility have remained low. Furthermore, it is worth noting that Jalisco never achieved as significant of a percentage reduction in movement as Baja California and Mexico City, in which workplace movement largely stayed above -40 percent.
It is important to note that unlike Mexico City Jalisco and Baja California encompass far more territory than just a major city. In this sense, it is possible that greater increases in movement could be occurring outside of Tijuana and Guadalajara, but the point still stands that in Mexico City people are moving less than their average level of movement than in Jalisco and Baja California.
These takeaways are part of a larger forecast that includes additional information beyond the scope of the analysis highlighted in this post. It will be updated weekly to include insights on the progression of COVID-19 for all Mexican states.