Let us know what type of content you'd like to see more of. Fill out our three question survey.
Data Management Series Part 1: Planning and Collecting
This post is one of a series of posts on Data Management.
Aug 30, 2017
If you’ve been paying any attention to the so-called data revolution, you may have heard the expression “Data is the new oil.” The phrase has been attributed to and adopted by countless people and organizations to whom the central reasoning is clear: In the information age, data is an incredibly valuable “commodity.” The purpose of the analogy as originally made by mathematician Clive Humby in 2006 is significantly deeper though. He said that data is valuable, but cannot be used if it is unrefined. Like oil, data has to be changed, transformed, broken down, and analyzed for us to actually draw out the value locked within. This is true for anyone producing or accessing any type of raw datasets, including development organizations.
At DAI, we produce a lot of data. It doesn’t rival Big Data streams from commercial enterprises or user-based social media platforms in velocity, variety, or volume, but it is still enough that it causes headaches on a daily basis. Our data sets are wide reaching, from water utility technical performance specs to citizen perception reports for local governments to climate smart agriculture surveys of small-scale farmers. We source primary data in many formats and utilize secondary data from partners. In our USAID portfolio alone, we have 60+ different teams managing their own streams of data. It is an ever-evolving ecosystem. It can be overwhelming, and maximizing the value we draw from all of this data can be daunting.
To better wrap our heads around activity, project, and institutional data, we structure our data management systems around a common framework—the Data Management Chain. Just like a value chain in any given market, it has different links that work together to take a raw product and turn it into a consumable good (think oil!). This isn’t a DAI proprietary concept or idea, but it’s one that we champion to ensure that our various teams have the best quality evidence to inform how they deliver project results:
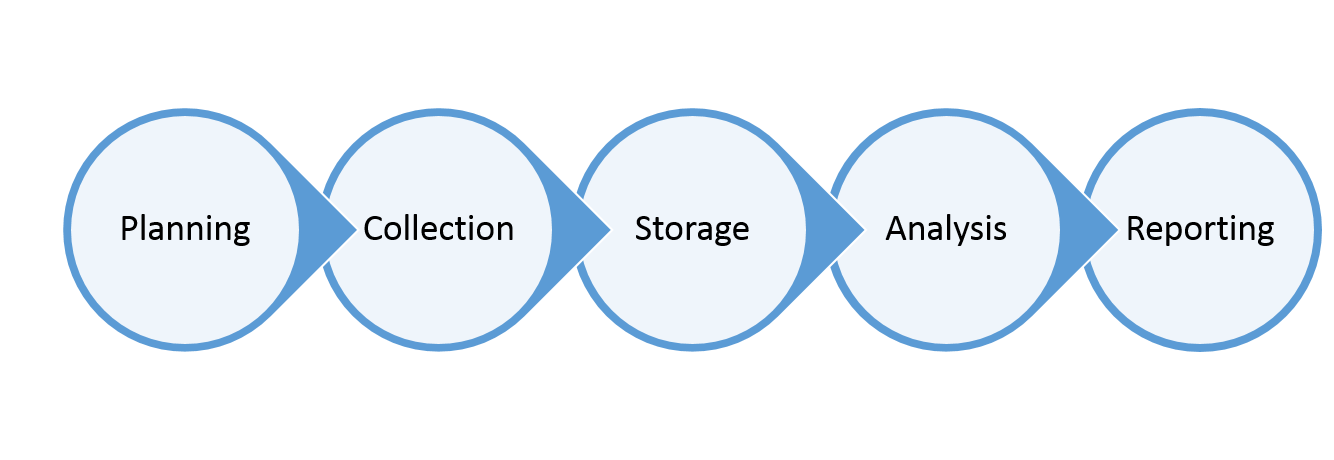
The Data Management Chain
All along this chain, there are two types of resources that are critical to ensure that the final product is high quality, actionable knowledge: human and technological. Fail to invest strategically in either one and you set up your data management system for failure. If you focus only on the human, you lose the ability to effectively refine the raw commodity at scale. If you focus solely on technology you will be refining a flawed raw commodity that limits the quality of your final product.
This chain starts with two very different links: one with low-tech, high human resource needs, the other driven by technology solutions. Like any activity, data management begins with making a plan. This plan is like any other and consists critically of a set of clearly defined roles and responsibilities as well as blueprint for the collection, storage, analysis, and reporting mechanisms and their interfaces. All of these elements that comprise the plan should be rooted in the answers to fundamental questions—What is the purpose of the activity and how will the final product be used? What kinds of data will have to be collected and analyzed to make this possible? What human and technological parameters and resources need to be considered to make this possible?
Setting up a data management system requires a plan.
While this part of the chain can be done offline, there are some insightful uses of technology to make the planning process easier and more effective. At DAI, we leverage a database of metrics and indicators, including historic results and standard templates, to make our plans stronger and informed. Our library of documents and results live within a SharePoint ecosystem that improve our ability to find and understand our past experiences. Monitoring, evaluation, and learning efforts often rely on adaptive management and iterative feedback loops to course correct over time—building your plan on the right collaborative platform (like Cisco Spark or Slack) can make it simpler for teams to discuss changes, pivot, and adjust their plan in the future.
Moving into collection, we begin to extract the raw commodity. The quality of our final product will rely heavily upon the purity of what we produce at this stage. On the human side of resources, this means that data collectors must understand the value of such basics and utilizing unique identifiers, using standard data formats for different data types, formatting datasets to be flat, etc.
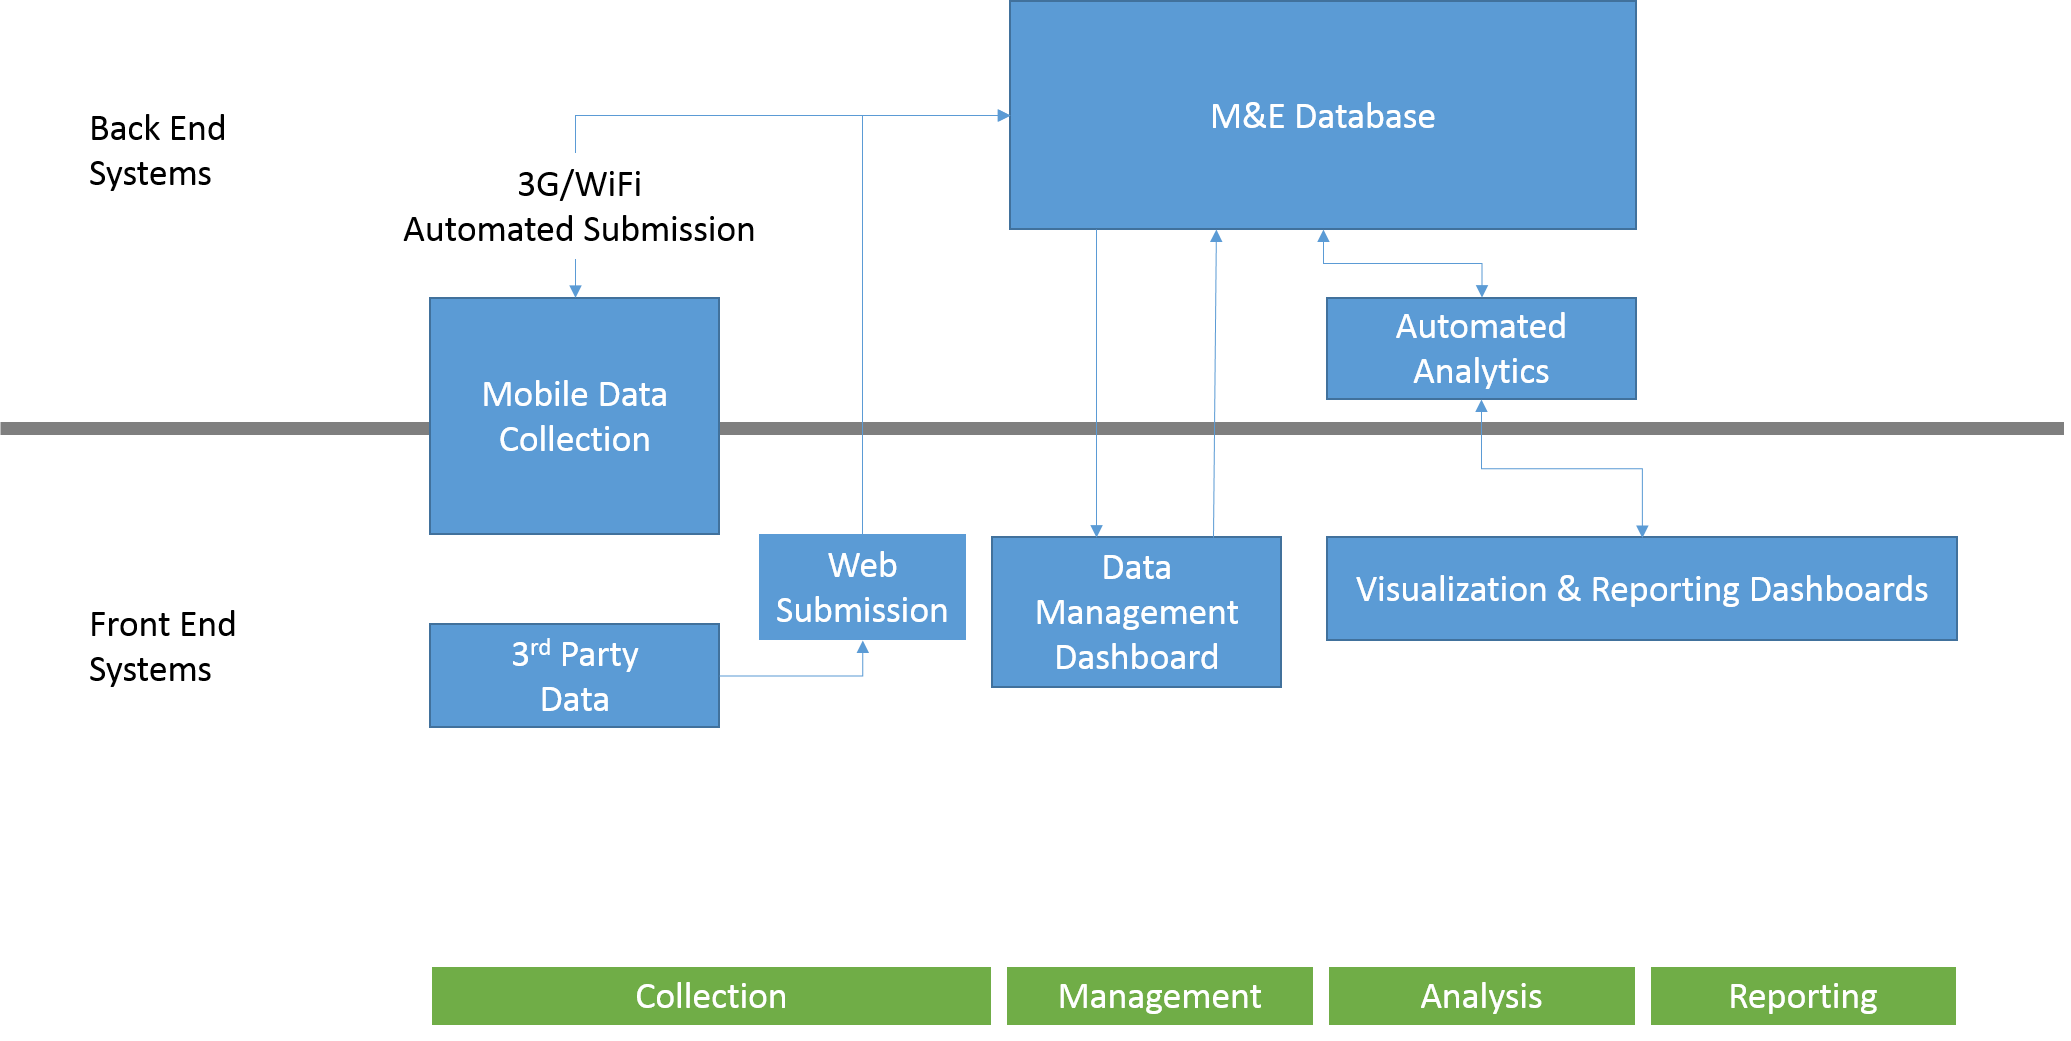
On the technological side it means using the right digital data collection tool wherever possible with built-in functions that increase collection efficiency and reduce human-error and data inconsistencies. We generally categorize our tools into three categories: mobile-, web-, or browser-based, and mass enumeration. Mobile-based tools are apps for smartphones and tablets which aid in field surveying, like a household survey or institutional assessment checklist, such as Fulcrum or ODK. Browser-based solutions require internet access and are great ways to build a survey with high-levels of logic that can be deployed to a large sample population, such as Google Forms or Survey Monkey. Mass enumeration tools leverage text messages or interactive voice response (IVR) systems to conduct simple surveys in low-bandwidth settings where internet and smartphone penetration is low, such as Voto Mobile or Bamba.
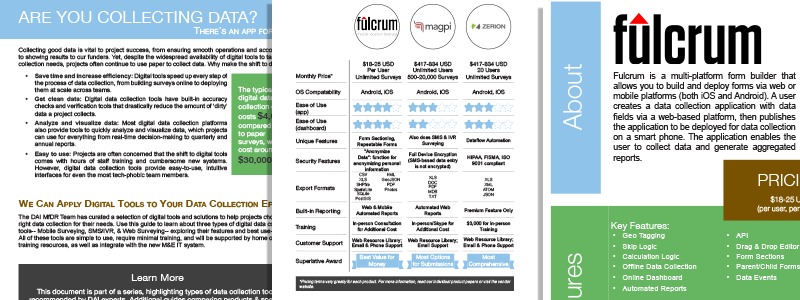
Technical briefs that we provide to our projects to help them select the appropriate data collection tools.
Each of these categories of tools has a place in data collection. Like Batman’s utility belt, it is our job to select the right solution for the right task and setting. Because no matter how strong your analytical capacity is, if your raw data is invalid, poorly structured, or missing, your final product will be inaccurate, incomplete, and irrelevant.
Tune in next week/Tuesday for our second post in this series: Data Storage.