Let us know what type of content you'd like to see more of. Fill out our three question survey.
COVID-19 Data Analysis, Part 5: Different Models of Infection Rates in Mexico and What they Tell Us
This post is one of a series of posts on COVID-19 Data.
May 5, 2020
The challenges of measuring the infection rates of COVID-19 are enormous for even the most prepared countries, given the need for testing to reach a significant enough amount of the population to accurately detect its spread. While the total number of recorded cases in the world thus far have mostly been in the United States, Europe, and East Asia, many low- and middle-income countries have begun to see increases in reported cases.
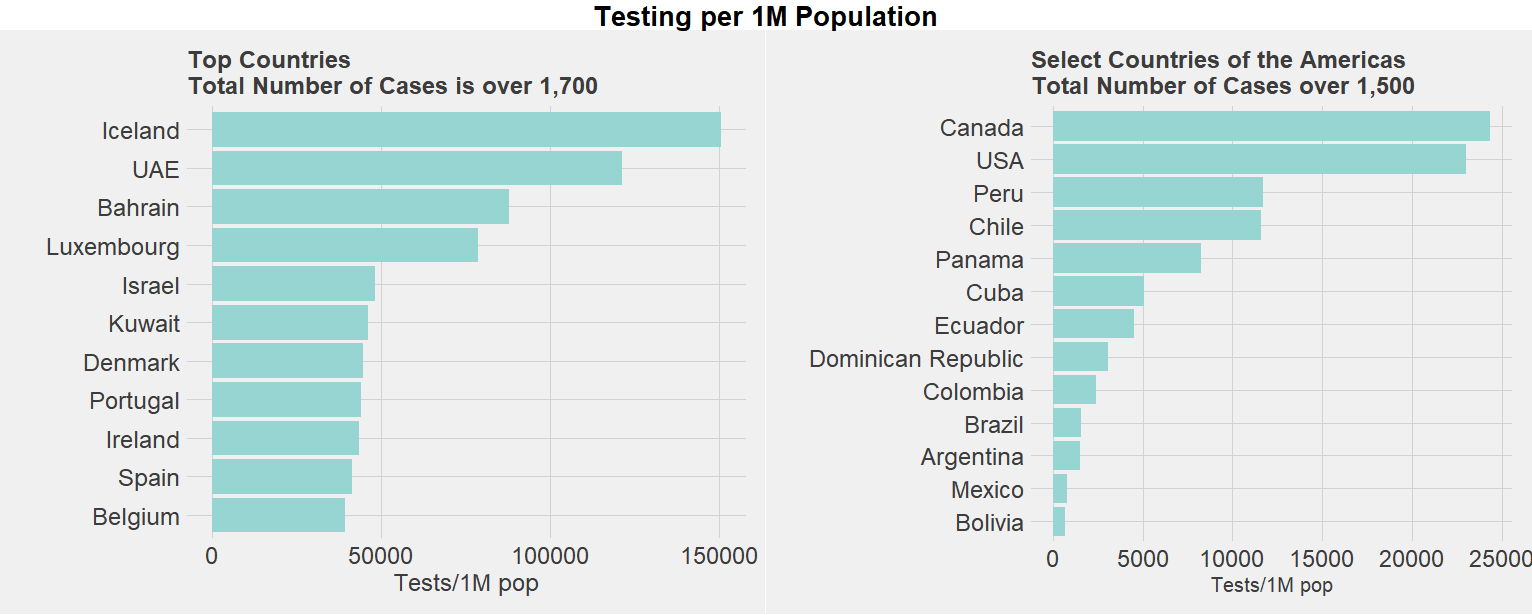
In Mexico, the number of cases has slowly risen. Public health experts have urgently suggested that testing needs to be dramatically increased to appropriately track the spread of the COVID-19 pandemic. As the graph below shows, the numbers reported from Worldometer corroborate this testing deficit, as Mexico has one of the lowest rates of testing per 1 million people in the region, even among countries of similar size and income per capita.
What inferences can we make on the spread of COVID-19 in a context of undertesting? In the previous post of this series, we focused on Mexico’s hospital capacity and the risks that different regions within the country face. In this post, we evaluate the spread of the disease thus far using models that forecast the number of infected and the rate of reproduction. Specifically, we highlight three different models:
- The SIR model, which consists of three compartments: S for the number of susceptible, I for the number of infectious, and R for the number of recovered or deceased (or immune) individuals.
- Modeling the effective reproductive number using the model outlined here.
- Estimating the number of true infected cases based on deaths. In doing so, we aim to assess not only the results but also the assumptions each of these models make and their limitations.
Exploratory Data Analysis: What We Know Thus Far
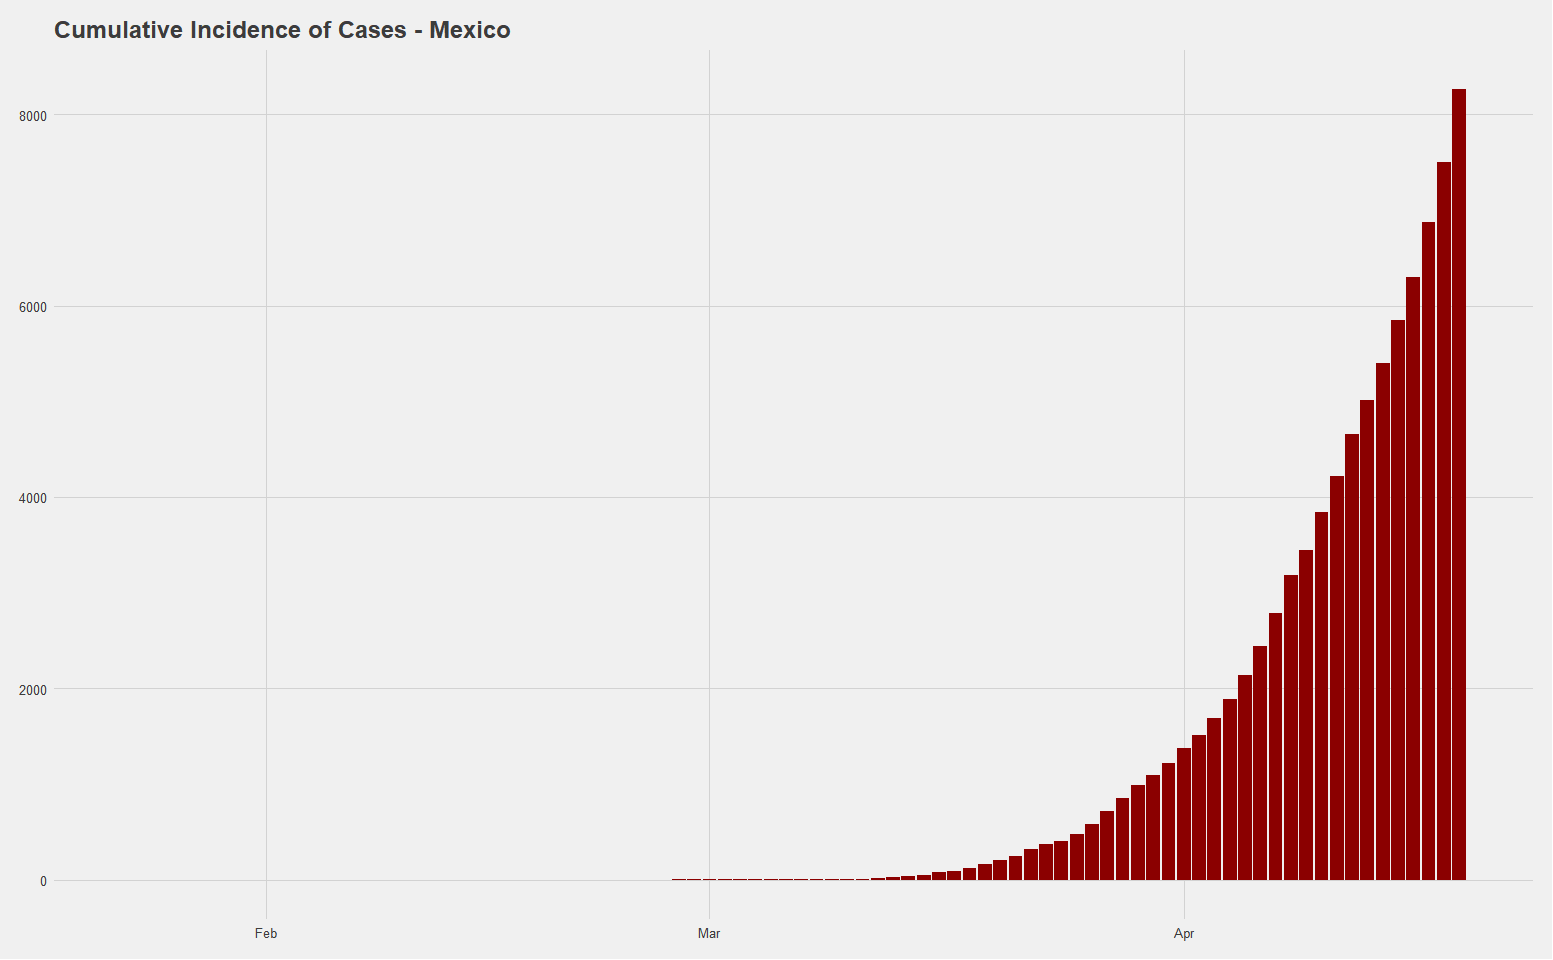
Based on data from the John Hopkins University School of Medicine, the first COVID-19 confirmed case in Mexico was on February 23, and as of May 5, the country has 24,905 cases and 2,270 reported deaths. The total number of cases of 193 per 1 million people is on the lower end of countries, which fits the narrative on the low number of tests per capita, which currently stands at 776 per 1 million people.
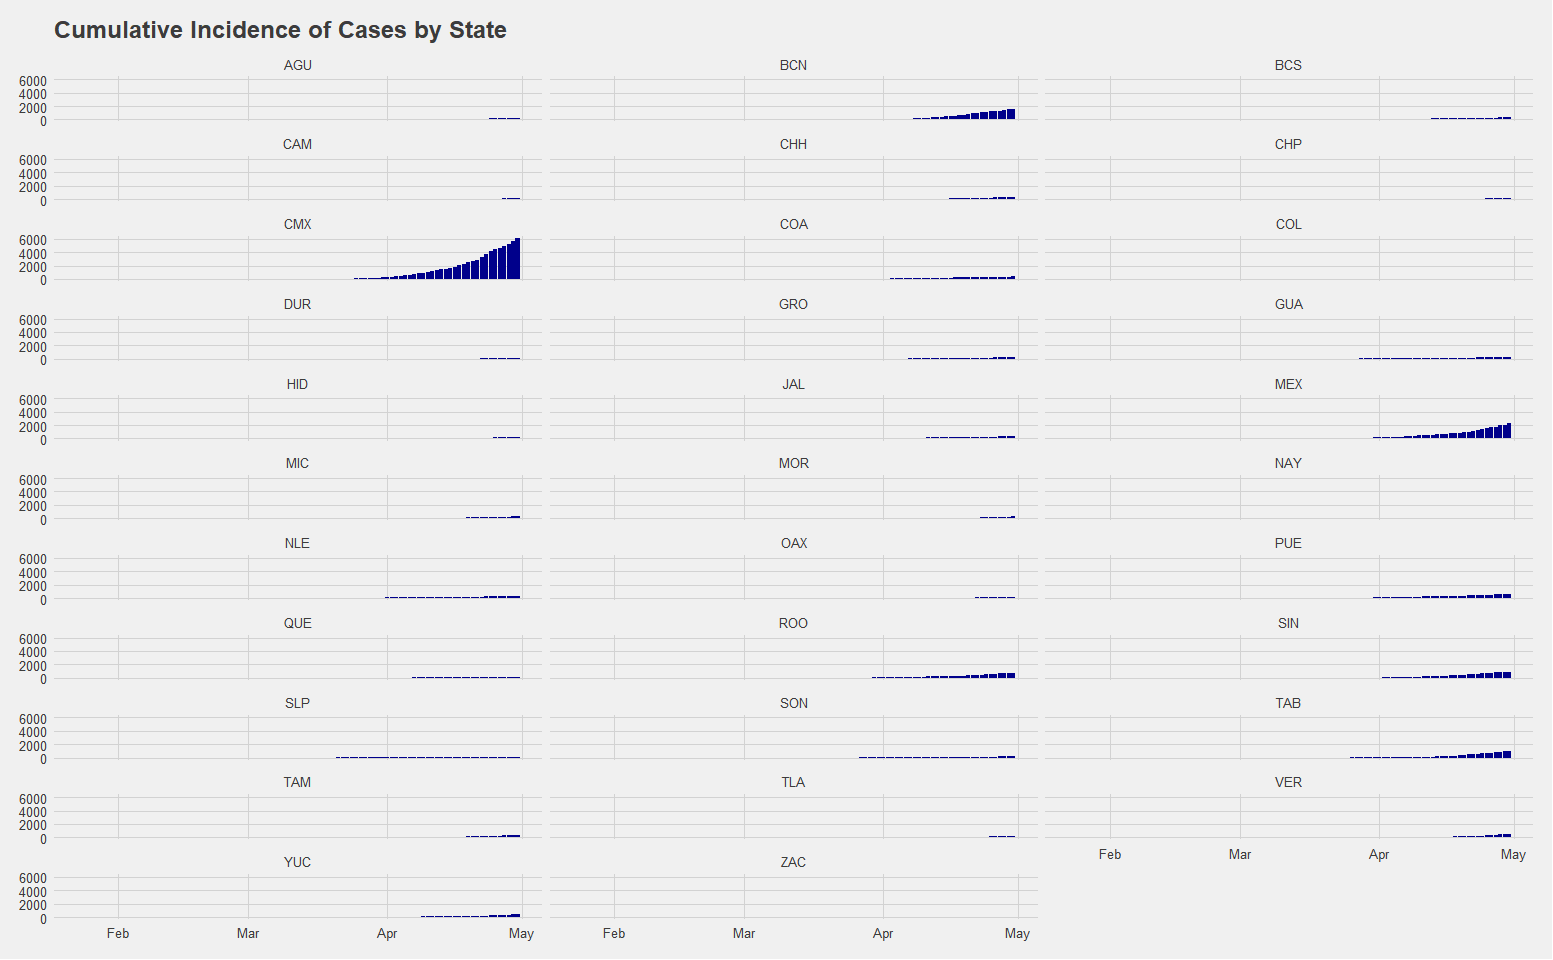
Utilizing data from the Secretary of Health of Mexico, a breakdown of the cumulative incidence of cases by state suggests that there have been significant regional variance, with Mexico City having the largest cumulative total of 7,916 cases. Estado de Mexico is the only other state thus far with cases over 3000, at 3,086. This distribution is likely reflecting reality in the sense that we would expect the largest city and area with the most amount of international travel to have the first cases, highest initial infection rate, and highest overall number of cumulative cases. Nevertheless, the clear issues with testing mean that the ascertainment rate, or the relative number of cases going undetected, is likely very high even in places such as Mexico City where there are at least some cases detected. The extent to which this is causing problems is not yet clear.
Attempting to Model COVID-19 in Mexico and Mexico City
Model 1: The SIR Model
Senior Fellow of the University of New South Wales Tim Churches’ excellent walkthrough on estimating outbreaks based on data in China provides useful tools to model the rate of infections that can be applied to Mexico. The SIR model is commonly used to forecast the dynamics of an outbreak. It consists of three differential equations to describe the rates of change between the susceptible, infected, and recovered populations. At a baseline, you begin with the full amount of the population as your susceptible population, the number of infected on the point in the time series for which there are cases and the number of recovered is naturally set to zero, since the outbreak has just begun. To find the rate of change between these populations, we conduct model optimization on the daily cumulative totals of the infected population to find the parameter values of the transmission rates from susceptible to infected and also between infected and recovered that minimizes the residual sum of squares.
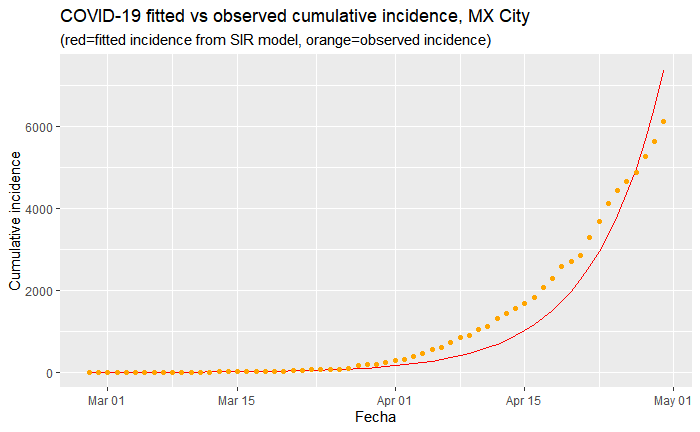
Above is a fitted model of infection rates that most optimally minimizes the residual sum of squares for Mexico City given the current trajectory thus far. It makes the most sense to focus on Mexico City, where the most number of cases have been reported, which is particularly important given the issues with testing. This will likely give us the most accurate reflection of what infection rates can be expected for the country as a whole.
This model estimates that the basic reproduction number (how many susceptible are infected by one infected person) of R0 is 1.15. This is significantly lower than estimates of the reproduction rate of COVID-19 from studies in China. It is lower than the generally accepted rates of SARS, which generally fall between 2.2 and 3.1.
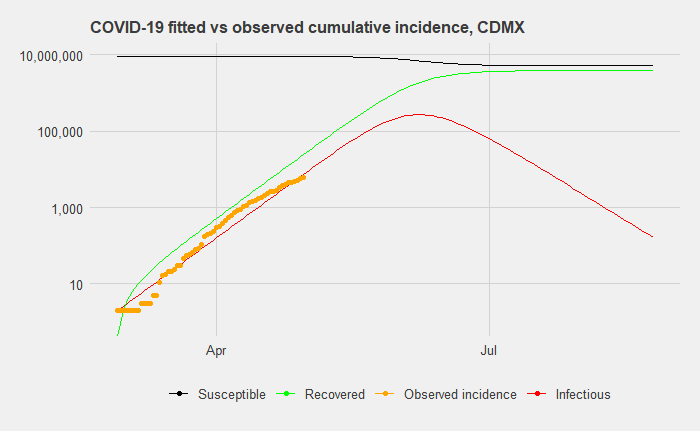
When we expand this model to a timeframe of 180 days after the first day of reported cases, our predicted cumulative incidence suggests a peak of 79,022 infected on day 94 (which is May 31st). (Note: the graph above uses a log scale). By day 180, a total of 2,232,154 people will have been infected and either recovered or died. For reference, Mexico City’s population is 9,018,652 (the entire metropolitan area has 21.2 million people). In reference to the previous article on the different scenario forecasts on hospital occupancy rates, this roughly corresponds to a 24.75 percent infection rate in a six-month window, which would put it in the middle range of scenarios for hospital occupancy rates.
Such a scenario in Mexico City would present enormous stress on health workers in the city and the entire Mexican health system. Furthermore, the likelihood that this is a best-case scenario is high, given indications of a high ascertainment rate, or a high number of undetected of cases.
However, it should also be noted that a simple SIR model such as this does not consider how different measures, including business lockdowns and social distancing measures, can help bend the curve. While this scenario may occur, it is not destiny, by any means. Additionally, SIR models have come under scrutiny in the specific case of modeling COVID-19 infection rates because the rate of decline has played out quite differently in reality, as several countries have seen their the case increase plateau without declining at the same rate as increasing.
Model 2: The Effective Reproduction Rate
One disadvantage of the previous model is that it makes predictions based on a fixed reproduction rate, when it can be more useful to estimate the current effective reproduction rate (Re). How infectious diseases spread can change drastically based on public policy interventions: While an initial Re may be very high at the beginning of a pandemic, social distancing measures or the introduction of antivirals can reduce it.
This brings us to the question of how the effective reproduction number may be evolving over time up until now in Mexico City and Mexico in general. It is still early in the outbreak, so these estimates should be interpreted with caution. In such a model, the effective reproduction number is estimated over time-interval windows of seven days. Given that the dataset thus far has 67 days total of data and the peak is unlikely to be soon, these numbers can change significantly with future increases in testing or a significant spike in cases.
To assess this, we utilize the existing records on imported and locally transmitted cases in Mexico City, which are recorded up to April 7. After this, we assume that subsequent cases are all local.
Along with this, we must impute the serial interval (SI), which is the time between onset of systems of each case and the onset of symptoms of secondary cases resulting from transmission from the primary cases. Based on a study of the first 450 cases in Wuhan, we run 1,000 Markov Chain Monte Carlo (MCMC) simulations to allow for variance in the serial interval with a mean serial interval distribution of 7.5 days and a standard deviation of 3.4 days.
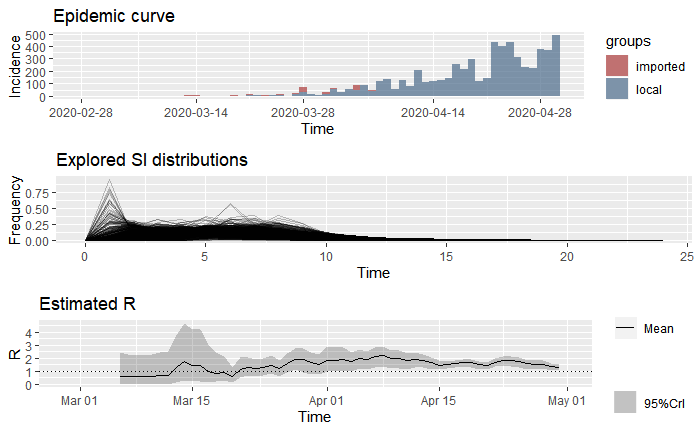
The estimated Re is provided in the bottom graph. This suggests that after an initial spike, the reproduction rate leveled off below the expected range of 2-2.5 and is slightly above the dotted line of R = 1, the tipping point whereby an infectious disease either spreads (R0 > 1) or dies (R0 < 1). For days 61-67, Re has a mean of 1.37 and a standard deviation of 0.73.
The federal government announced the suspension of nonessential activities for the entire nation on March 23, 2020. In this context, there is evidence of a very slight decline having taken place in the most recent, while it appears that the rate of reproduction went above Re = 2 immediately after lockdown. The increase during this time might be a reflection of how low testing was during the initial 30 days.
How does the effective reproduction rate of Mexico City compare to Mexico as a whole? Below we provide estimates to the data of all imported and local cases in Mexico, utilizing the same two scenarios as previously drawn out with Mexico City.
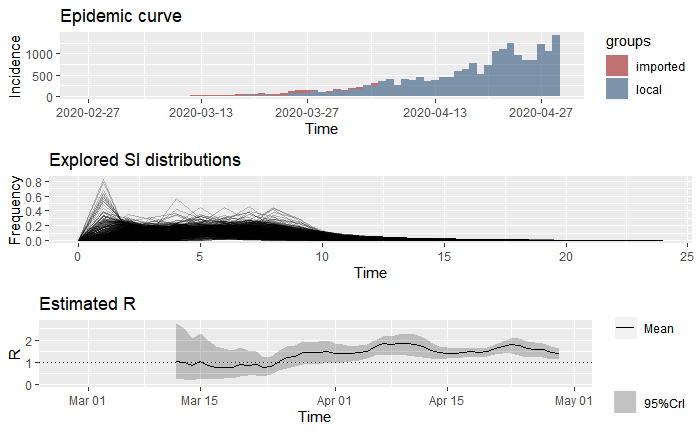
Similar to the trend in Mexico City, the data for the entire country suggests that after artificially low reproduction rates due to a complete lack of detection. The Re approached rates closer to the accepted rates around 2 and only recently has leveled off at a mean of 1.36.
The evidence provided by estimating the reproduction rate suggests that the disease is spreading slightly lower than what we would normally expect, although the clear lack of detection of the total number of cases in all parts of Mexico limits one’s ability to accurately predict the total number of infected and timeframe of the spread. Perhaps when other countries begin to experience a dip in cases and demand for test kits lowers, countries such as Mexico will be able to ramp up testing and provide researchers with a clearer picture to model infection for all regions.
Model 3: Estimating Infection Rates based on Deaths
A problem with the previously reviewed models is that they rely on testing capacity providing reliable insight in capturing the number of infected. Trying to make sense of the world with flawed data is a problem that isn’t unique to COVID-19, but given the speed of its spread it calls into question the use of other methods to estimate outbreak.
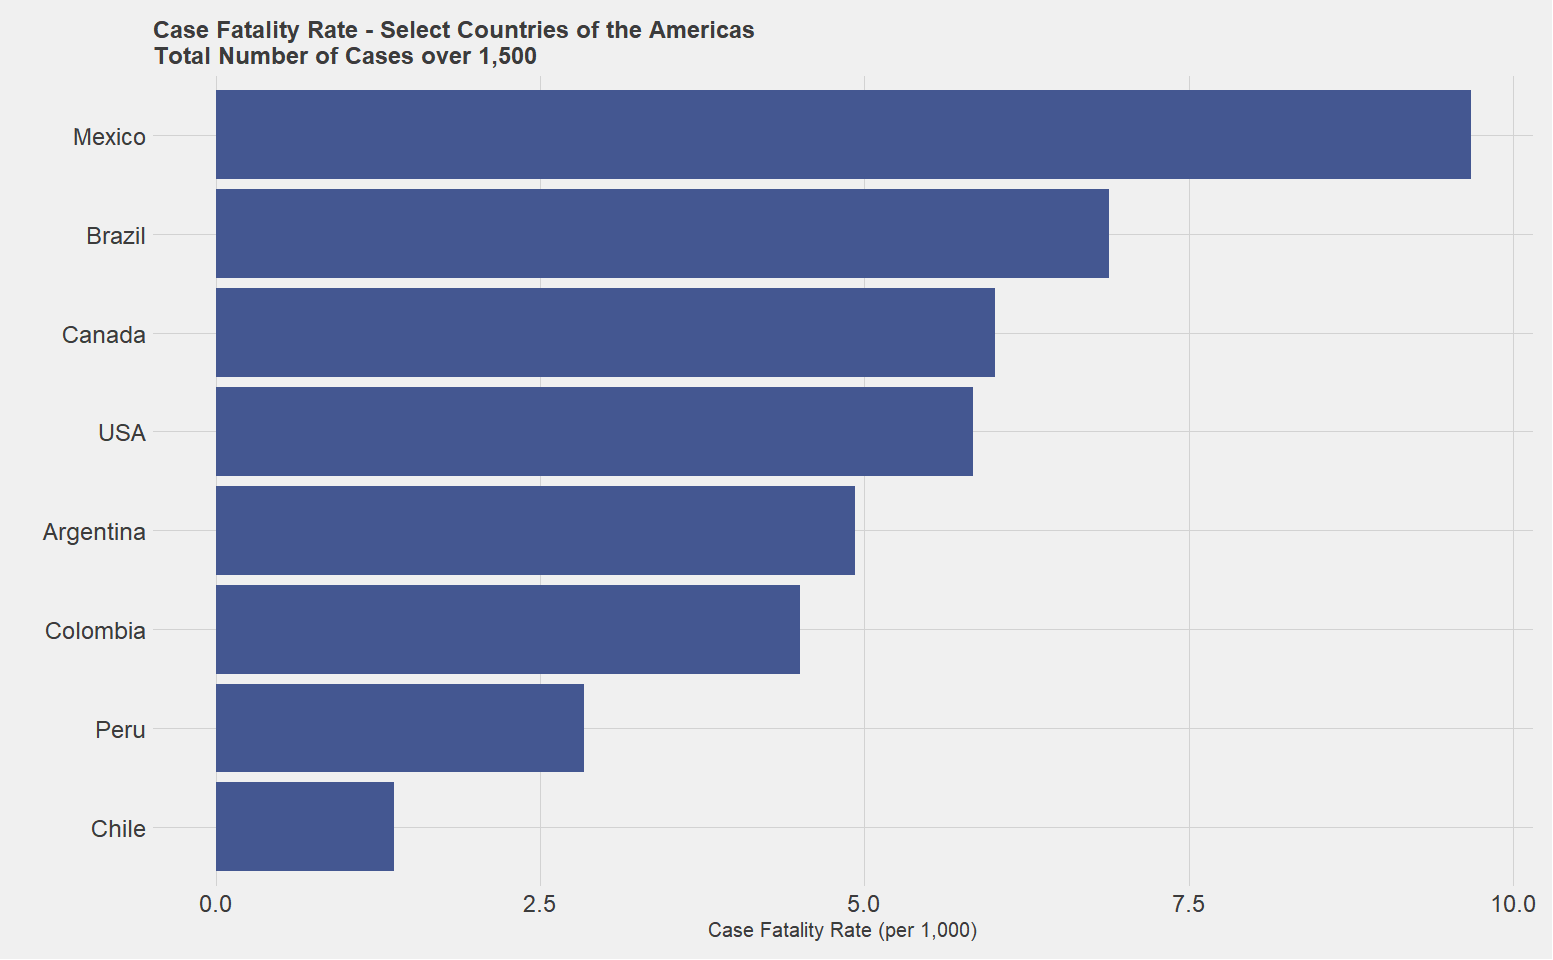
The figure below shows that Mexico has a very high case fatality ratio, particularly for a country that has not reached a peak in the way Italy, Spain, and other countries have. This leaves two possibilities: one, that the strands of COVID-19 in Mexico are more deadly, or the more likely explanation is that cases are artificially low in Mexico relative to the rest of the world.
In this context, several forecasts such as Institute for Health Metrics and Evaluation (IHME) of the University of Washington and Imperial College COVID-19 Response Team have worked backwards by using daily incidence of deaths to provide an estimate of the true number of infected. The IHME projections are primarily based on a generalized logistic regression model, while the Imperial College estimates utilize a negative binomial regression model first to estimate death rates and then use a posterior distribution to estimate the true number of infected. Different from the SIR model, both models rest on three principal assumptions: deaths due to COVID-19 are perfectly reported; there is a known distribution of reporting cases to death; and there is a known case fatality rate.
Based on these assumptions, the estimates of infected rates will vary according to the case fatality rate provided. The IHME projections, most notably, utilize the .99 percent rate of the Diamond Princess cruise ship, which is on the lower end of estimated rates. For reference, the 1.1 percent case fatality rate was estimated in Wuhan and numbers have been higher in many places in Europe. The use of this rate is justified as the most approximate estimate due to the controlled scenario in which it occurred, thereby limiting confounding factors such as lack of testing capacity and imported cases.
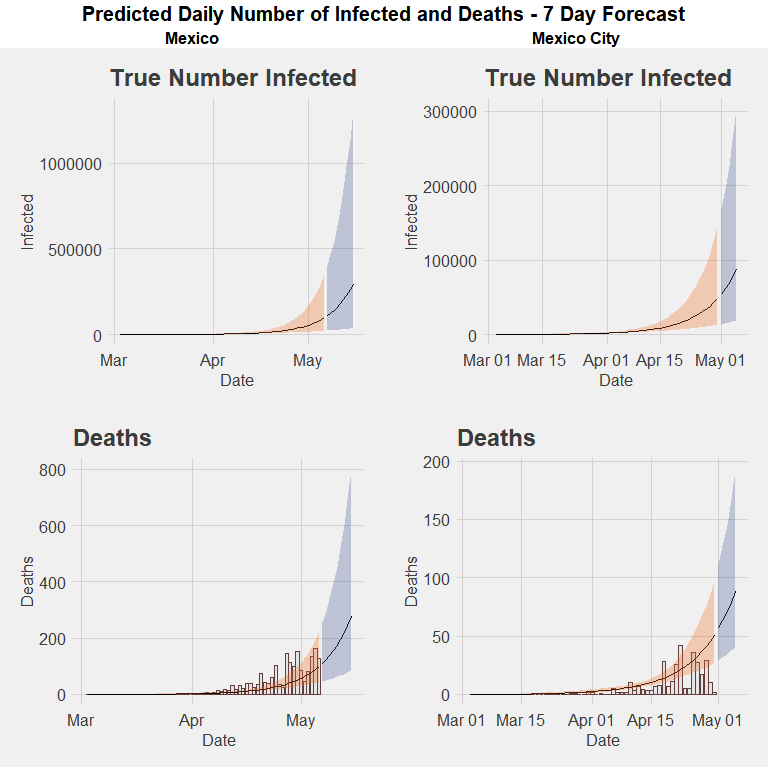
When using the Imperial College model with the case fatality ratio of the Diamond Princess cruise ship fit to the number of found cases and deaths in Mexico City, as of May 1, the estimated percentage of the cumulative number of infected of the entire population is 3.87 percent (383,281 individuals), with a 95 percent confidence interval of +/- 3.43 percent. Using the mean, this would suggest that in Mexico City a total of 2 percent of all cases have been detected. This would indicate a correction number on the highest magnitude suggested by the Mexico’s coronavirus czar Hugo Lopez-Gatell in an (interview)[https://medium.com/@richardensor_50805/a-chat-with-mexicos-coronavirus-czar-e2117a3a4757] last month.
When these estimates are run on Mexico at the national level, the estimated cumulative number of infected is .5 percent of the entire population (670,356 individuals), suggesting 3.7 percent have been detected. Based on this method, the current average effective rate of reproduction Rt is higher in Mexico than in Mexico City, at 1.82 and 1.73, respectively.