What Bike to Work Day Tells Us About Open Data
May 19, 2017
More than 17,000 Washington, D.C.-area residents are commuting by bicycle today, as part of the 17th annual Bike to Work Day. The event’s rising popularity parallels the region’s growing investment in bicycle infrastructure and multimodal transportation. This is a positive trend, particularly for those of us who want cities and urban areas to provide safe, convenient, and diverse transportation options for all residents. But is there a larger message for international development? What can Bike to Work Day tell us about the importance of open data for civic engagement?
Let’s say that you’re sitting at home in Arlington, Virginia, preparing to strap on your helmet, save your Metro fare, and bike to DAI’s office in Bethesda, Maryland. You need to find a source that provides bike accessibility information (trails, bike lanes, bike share stations) for your entire route, which will likely take you through three jurisdictions—Arlington County, Washington, D.C., and Montgomery County—that have different levels of bicycle infrastructure. However, you find that there are no consolidated bike maps for the broader Washington Metro area. You consider using Google Maps, which does provide some helpful information—but you still need much more detail, and prefer a format that more clearly distinguishes between different paths and roadways.
Open data—in combination with interactive, online mapping platforms such as CARTO (formerly CartoDB)—can solve this problem and help you create your own visualization of DC-area bike infrastructure. Arlington County, D.C., and Montgomery County maintain active and regularly updated open data portals, per their respective open data policies. Their publicly available data covers most areas of local governance, including land use, public safety, and—most importantly for your bike ride—transportation. Each data portal contains individual transportation datasets on bicycle infrastructure, available for download in a variety of file types—CSV, Excel, KML, etc.
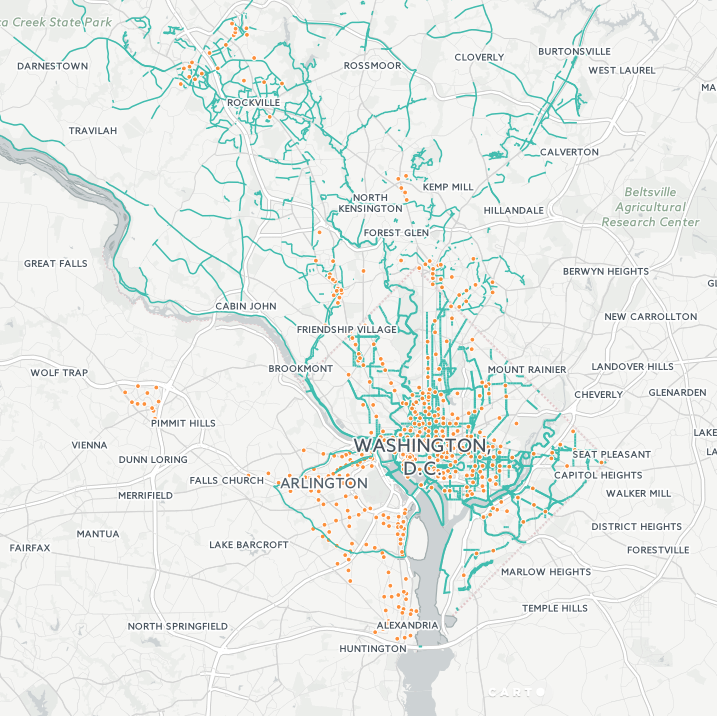
Since you would like to create your map using CARTO, you should download the data in KML format, a file type that contains geospatial information. Once you download the bicycle data from each portal, you can create a free account with CARTO and then upload your datasets. CARTO then allows you to merge the data as layers on a single map. In this case that means four stacked layers: (1) Arlington data; (2) D.C. data; (3) Montgomery data; (4) Capital Bike Share data. The initial result will look something like this:
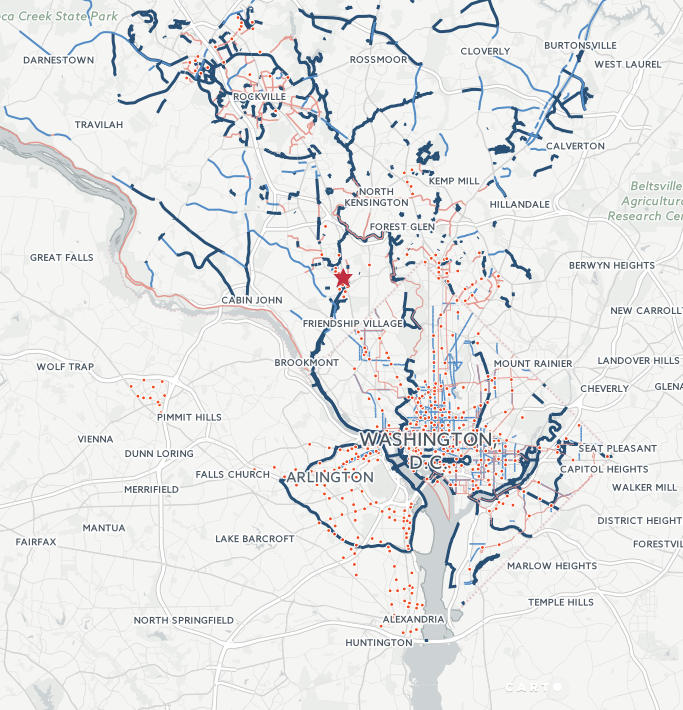
Next, you can style these layers to facilitate a better understanding of the infrastructure landscape: coloring and sizing routes by type, creating some interactivity through pop-up information windows, etc. You can also change the basemap to a style that provides maximum clarity for your data layers. In this case, that may include choosing a basemap without much color and with limited labels. This will allow your data layers to stand out. Click on the map below to check out the final result:
That’s all it takes! This is a simple version of what’s possible, and with a little knowledge of languages such as JavaScript, Python, or R, you can create even more powerful visualizations using this kind of geospatial data. However, using the open data that’s available online—courtesy of our local governments—you can build your own interactive bicycle map without any coding languages.
The global movement for open government data allows citizens to benefit from the information that governments produce and collect. In this case, open data helps us build a simple map that assists in finding a bike-friendly commute amid an otherwise chaotic transportation environment. But there are, of course, many other far more important benefits as well. Researchers can use open economic data to enhance their understanding and assessments of public policy. Businesses can use demographic, census, and transportation data to better target consumers. And civil society organizations can use government financial and procurement data to help safeguard against public corruption.
The uses are many, yet the cost to government for enhancing civic participation—and, by extension, improving government effectiveness—is comparatively low. In many ways, governments that open their data for public consumption are engaging in the most influential form of citizen-state relationship building. It’s an easy way for governments to help their citizens make more informed decisions about their daily needs. Ultimately, we all benefit from open data—particularly on days like today, when 17,000 people are biking to work!