Remote Sensing Series Part 1: The Foundations and Applications of Remote Sensing
This post is one of a series of posts on Remote Sensing.
Dec 14, 2016
This is the first in a series of posts about remote sensing. DAI is entering an orbit of excitement about the upcoming SatSummit on January 31!
Origins of Remote Sensing
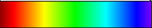
One day in 1800, German-born British citizen and musician-turned-astronomer, Sir James Herschel was doing something we’ve all found ourselves doing on lazy Sunday afternoons: He was playing around with a prism, investigating the temperature differences between the bands of colorful light that splay out in this familiar natural sequence:
Herschel placed a thermometer to the left of the red band and found invisible infrared light.
Herschel then placed a thermometer underneath each color and took note of the difference in temperature. He put another thermometer to the left of the red light, outside the range of the colored light. That’s when something unexpected happened. The highest temperature was found there, left of the red area outside of the visible range!
Herschel discovered infrared light, identifying for the first time a physical property of light that is most appropriately described by a cliche—there is more than meets the eye. While we humans can only see the light in the rainbow color spectrum, there is a far wider spectrum of light zipping through space, reflecting off things, revealing properties of the things it reflects against. This full spectrum of light, comprised of both the colors visible to us humans and many other invisible bands, is called the electromagnetic spectrum. It is hard to imagine invisible light but many of the invisible portions have familiar names like x-rays, microwaves, and radio waves. All of them are part of the same spectrum, just separated by the size of the wavelength.
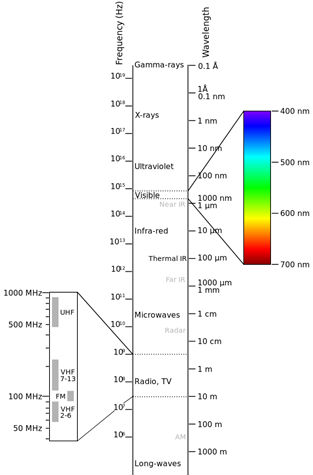
The electromagnetic spectrum. The visible portion is tiny.
This understanding and analysis of the different properties of light at different wavelengths helped launch a discipline called remote sensing, in which we study the earth with satellites, planes, drones, and sensor technology.
Remote Sensing
Let’s put forward a definition of remote sensing. Iain Woodhouse of the University of Edinburgh is one of today’s great remote sensing minds and he defines the field in this way:
Remote sensing is the science of measuring or inferring the physical properties of an object or medium using a sensor that is at some distance from the object or medium…
Remote sensing is not confined to satellites; it can also be conducted from an aircraft or handheld device. A simple camera on a smartphone is a form of remote sensing. For this post we will focus on satellite collection of remotely sensed data because it has the advantage of covering huge spans of the globe in just days or hours.
Landsat
Landsat is a satellite program started in the 1970s and operated by the United States Geological Survey and NASA to collect remotely sensed data. It is a tremendous source of free imagery and data, all provided to the world for free by the U.S. taxpayer. Today, the eighth incarnation of the Landsat program is orbiting the earth at an altitude of 705 kilometers (438 miles) and circling the globe every 99 minutes. We will have a subsequent post that goes into a bit more detail about Landsat and the new tools available for analysis.
Landsat global imagery coverage, 1972-2016, on https://t.co/ZBCTIqYhPv via @lindamood pic.twitter.com/q2Oajh1OcI
— Lisa Charlotte Rost (@lisacrost) December 7, 2016
Bands and Landsat8
Landsat8 sensors detect light at different sections of the electromagnetic spectrum. Each section is referred to as a band. Here is the breakdown of the different bands:
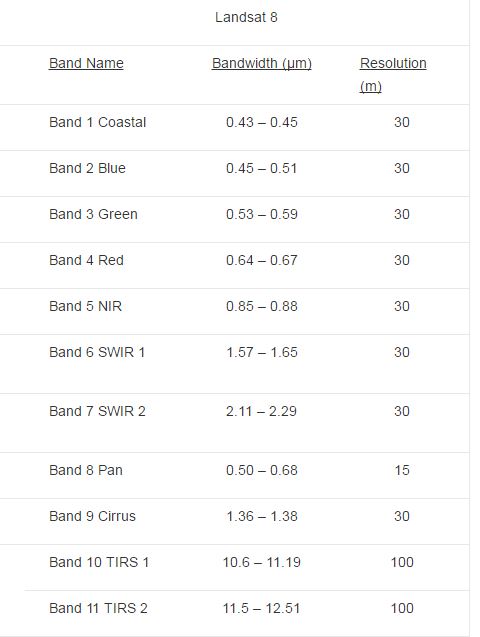
Landsat8 bands: source ESRI
Landsat data is available in raster format, with one raster for each band collected by the sensors. With remote sensing software you can layer these bands together to produce images of the earth, emphasizing different portions of the spectrum.
Let’s take an example of a visible color image. This is pretty close to what it would look like if you looked at the eastern Democratic Republic of the Congo (DRC) and western Rwanda with the naked eye from 438 miles above the earth.
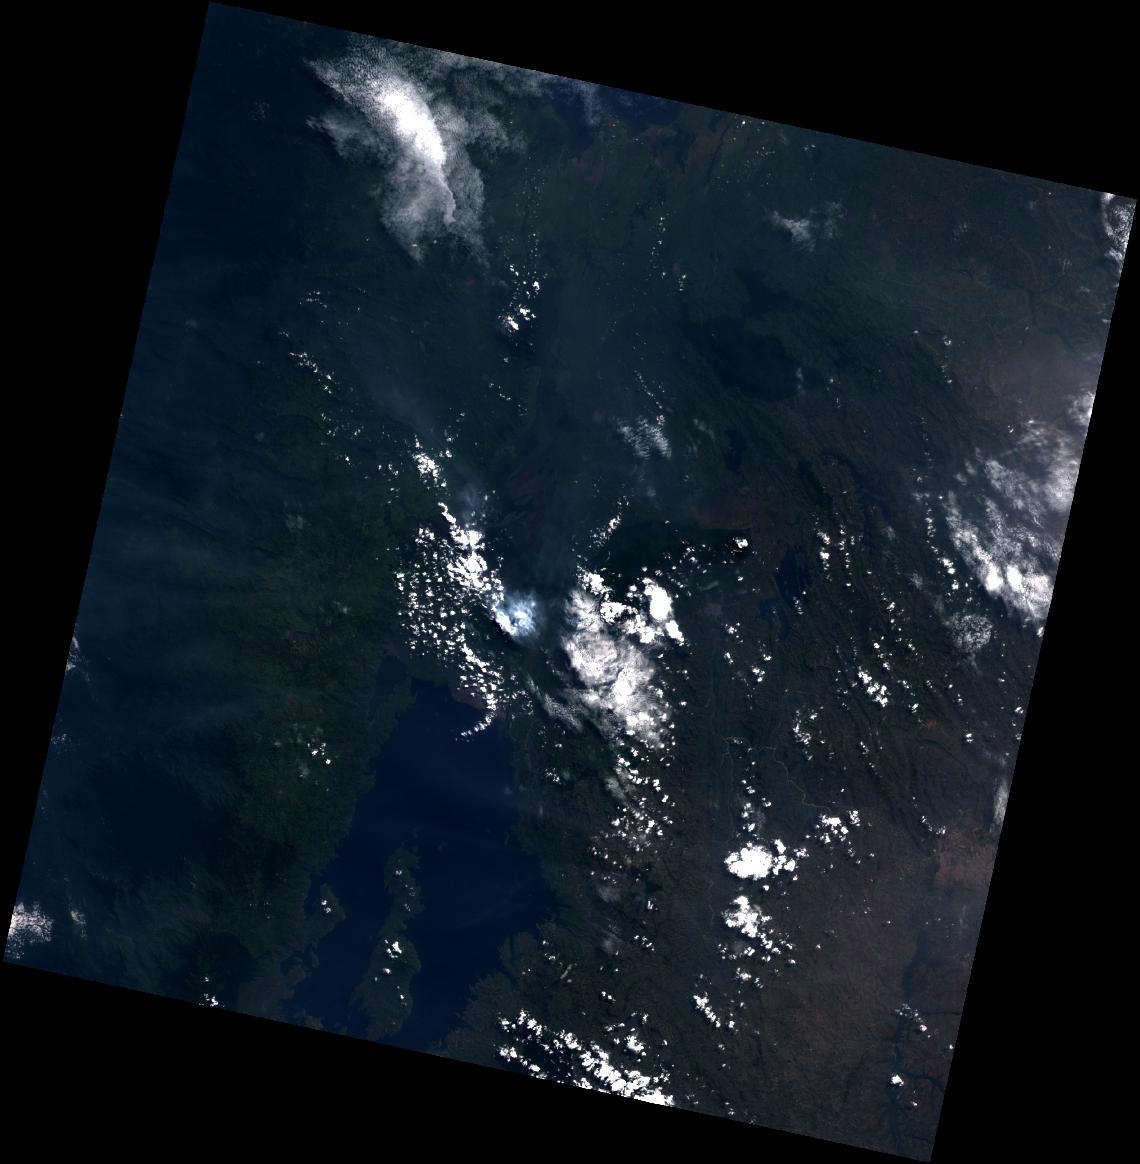
Approximately what the eastern DRC looks like from a human eye in space.
Not terribly exciting, right? It is kind of hard to see what is on the ground, there are some very bright white clouds reflecting the full light of the sun back at the sensor.
Now let’s sort of replicate Herschel’s experiment and look at a warmer edge of the spectrum. This is the thermal infrared layer (band 11) from Landsat8. I also zoomed in a bit:
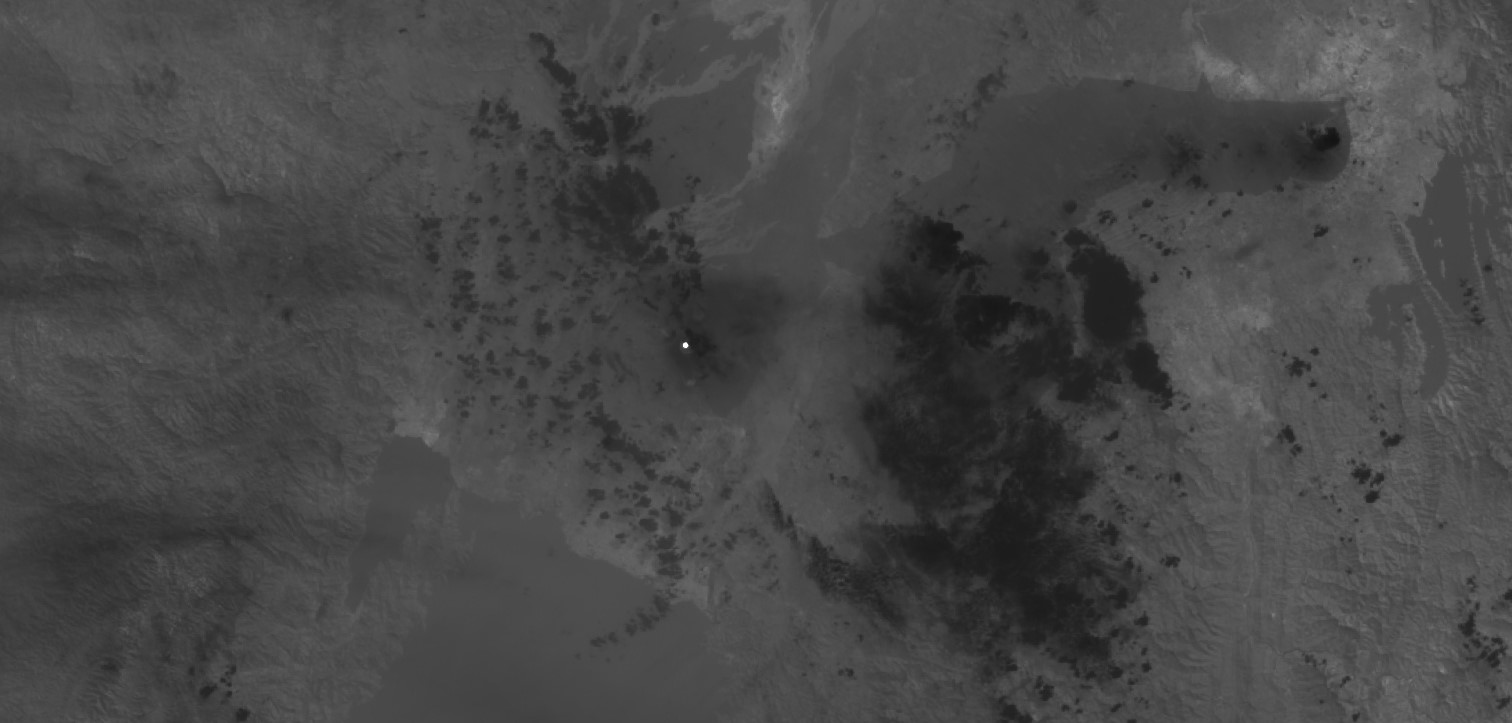
A thermal image of the eastern DRC shows a very hot spot indicated by the small bright white circle.
Wow—now the clouds are dark and there is a small bright white circle of light in the center of the image. Thermal infrared is radiant heat so this image is telling us that us that something extremely hot is there nestled between those clouds. The clouds are dark because they are cool and not emanating much heat at all. Looking at this location on Google Maps we see that it is the Nyriangongo Volcano, home of the largest lava lake in the world. That explains the extreme heat!
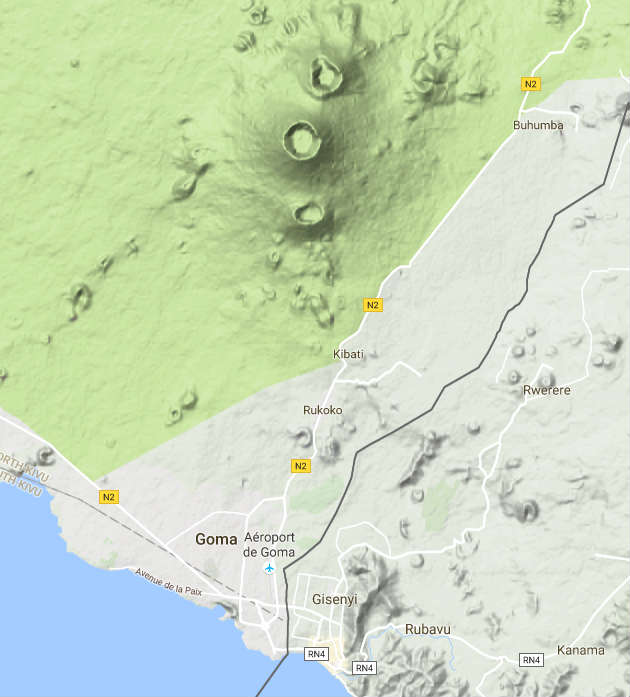
A terrain image of the Nyriangongo volcano near Goma.
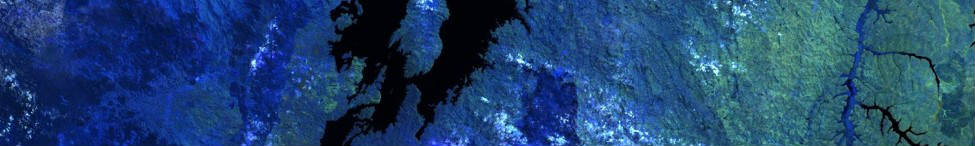
Now let’s play with another combination of bands. Near-infrared light (band 5) of the spectrum is heavily reflected by healthy vegetation. This image composition uses those bands and highlights lush healthy vegetation with deep blue colors. Technically, this is a 7-6-5 image.
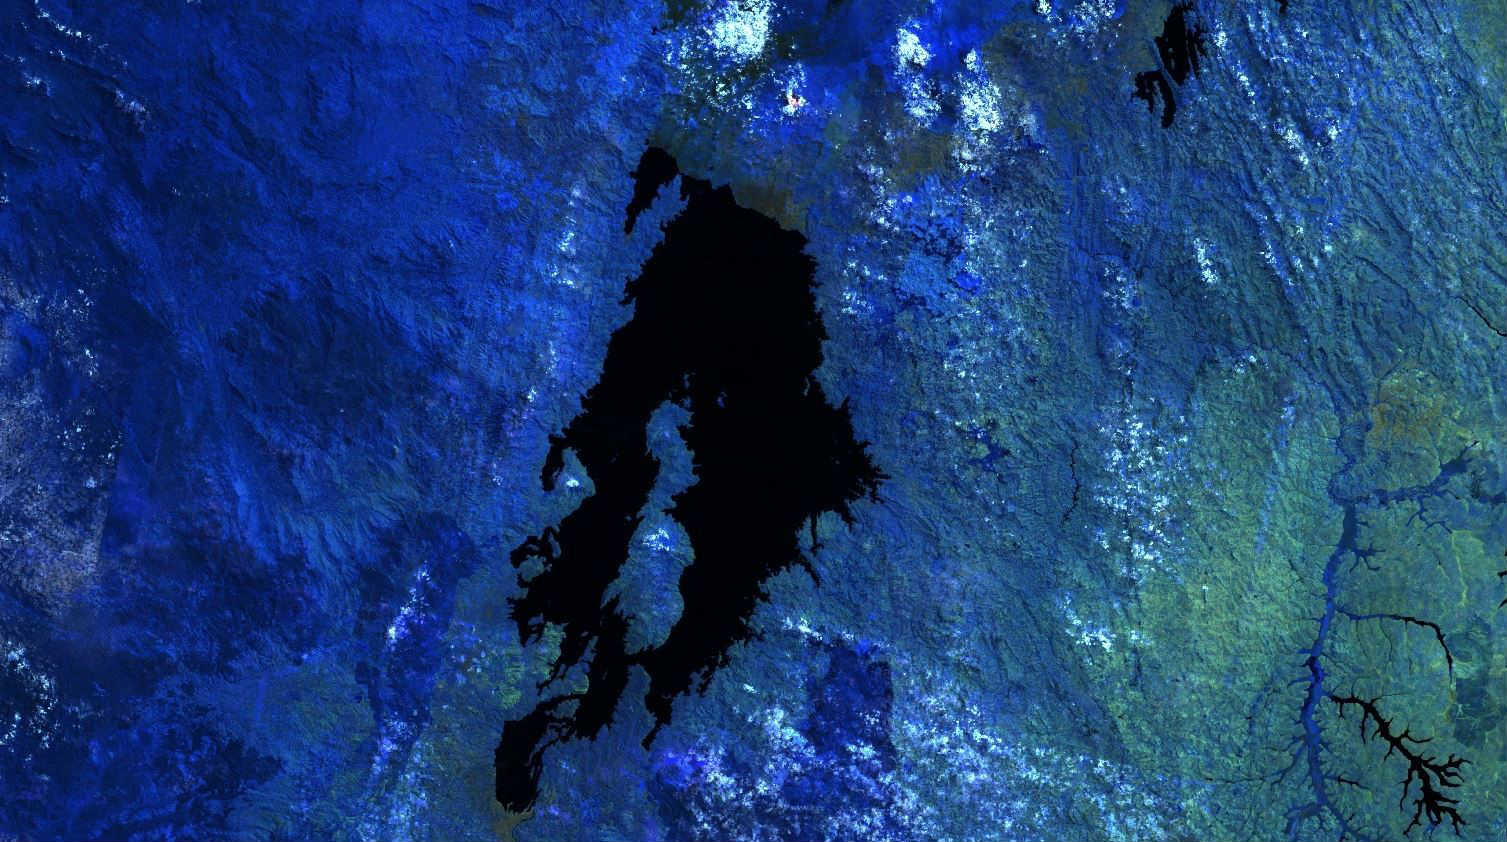
Deep blues in the west reflect healthy vegetation. Greens in the east are signs of cultivated land.
With this image, a tale of two countries appears. In the middle is Lake Kivu, to the west is eastern DRC and the green area to the east of the lake is western Rwanda. The deep blue in the DRC highlights the thick forested region and the green areas in Rwanda show the intensity of agriculture in that area. This makes sense with a much higher population density in Rwanda.
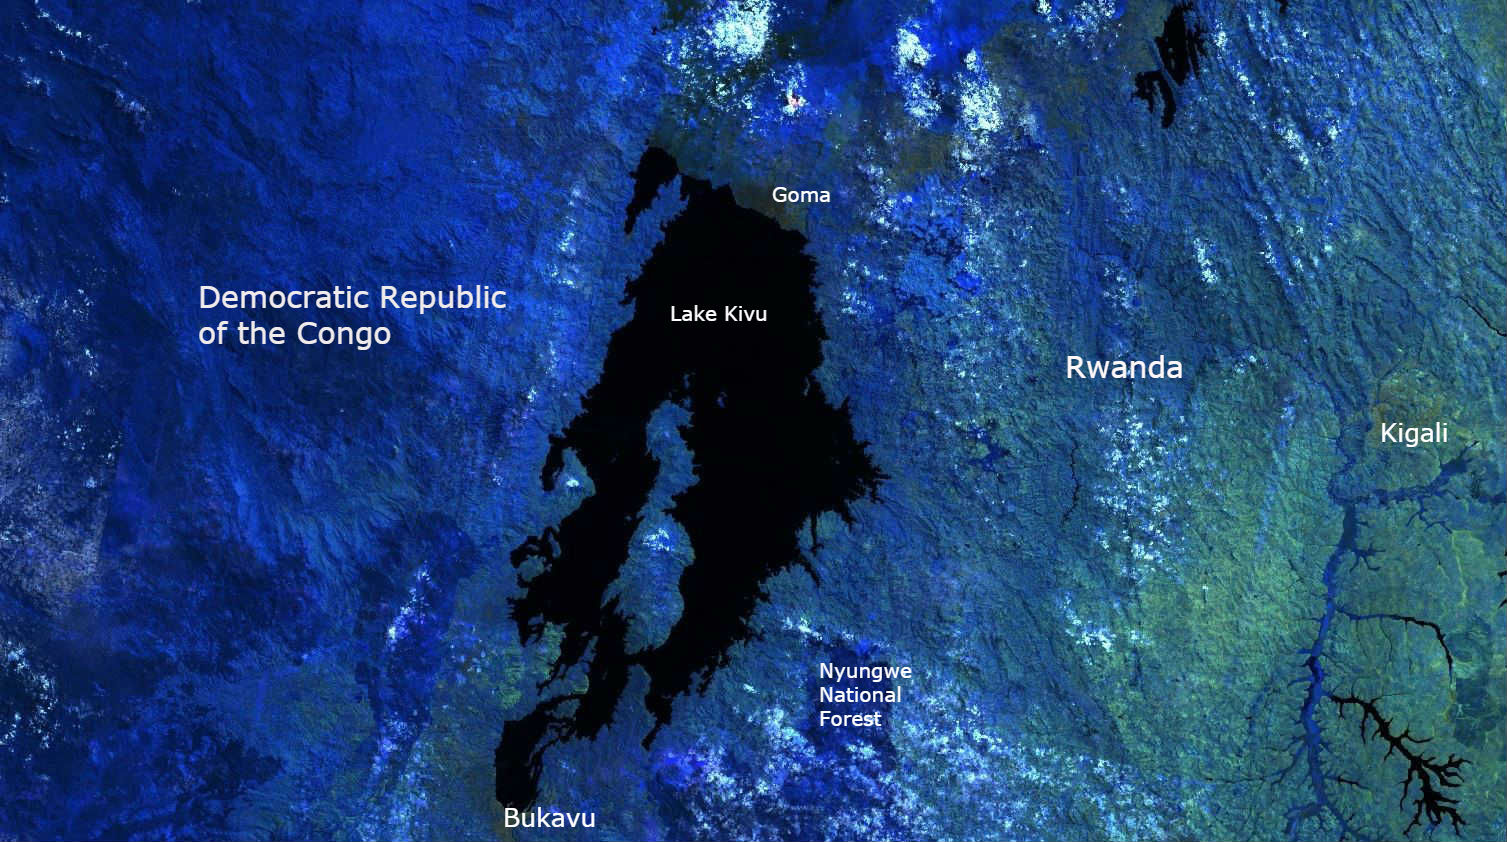
Labeled image composed of bands emphasizing healthy vegetation.
Remote Sensing Applications for Development
So how can we apply remote sensing to development? There are endless possibilities. One of the classic agriculture applications is to examine the health of vegetation. Because satellites are taking snapshots of the earth on very regular intervals, we can monitor change in vegetation quality. In this next image we compose an image of vegetation health using data from 2008 and 2010. This image represents the change in vegetation health that occurred between those two years with red areas showing a decline in vegetation and bright green indicating a strengthening of healthy vegetation. Clearly the bright green areas are some kind of highly organized area for agriculture.
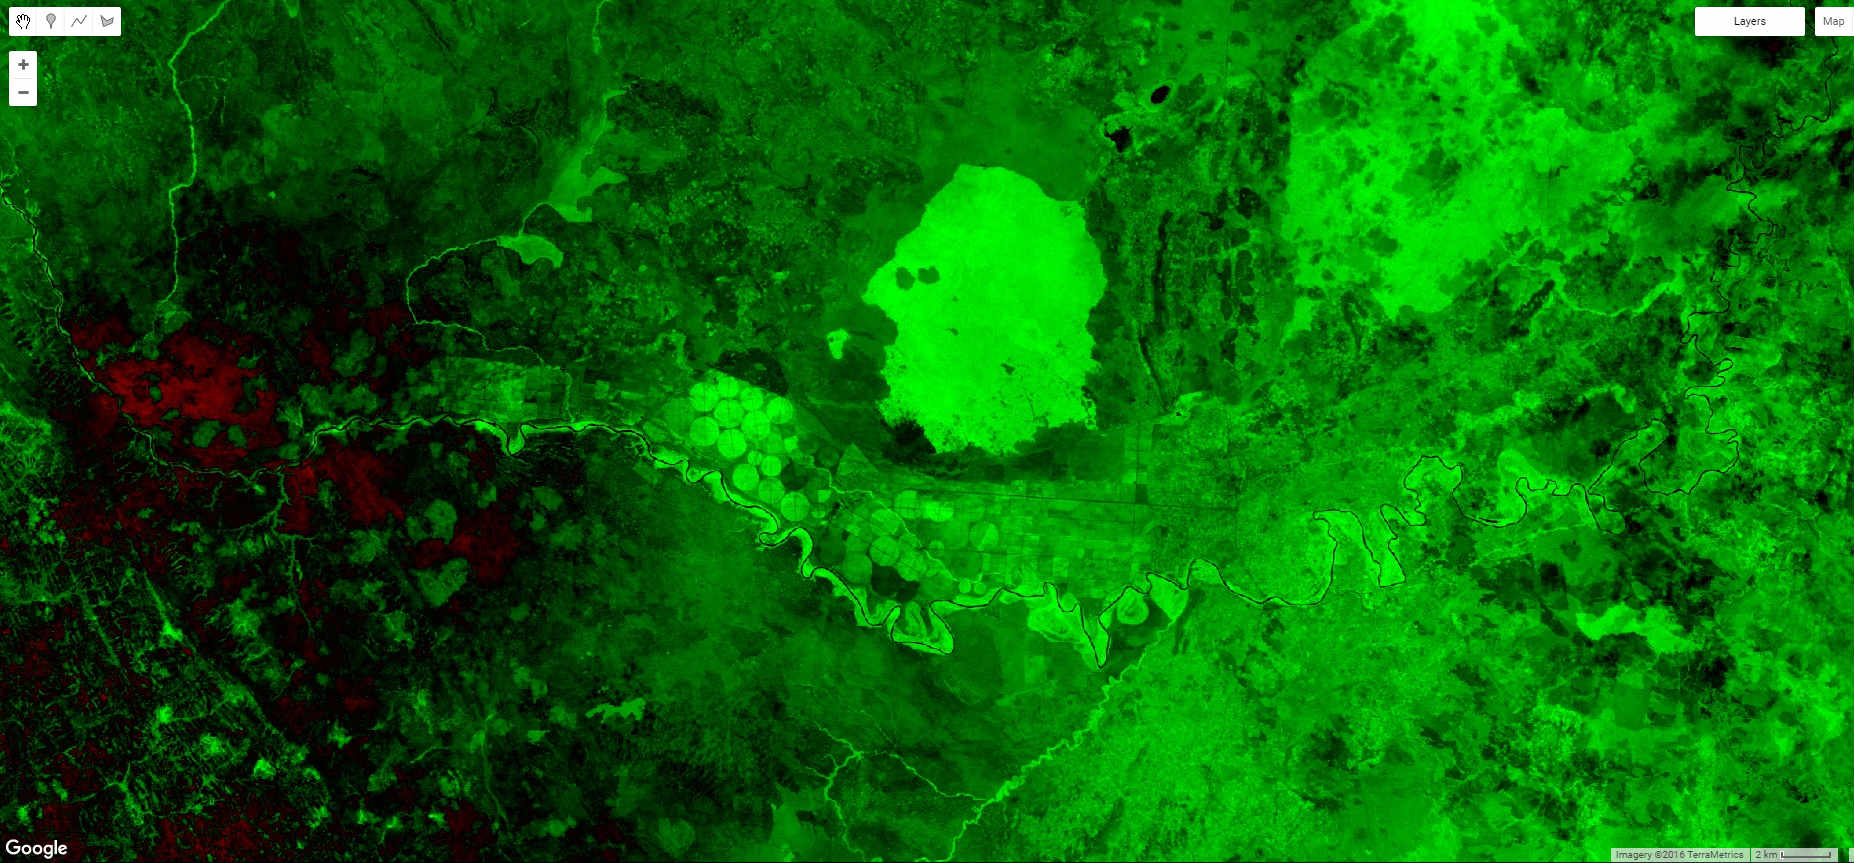
Change in vegetation health (NDVI) between 2008 and 2010 near in Tanzania, just across the border from western Rwanda. Red areas show a decline in vegetation health, bright green represents an increase in healthy vegetation, and black is no change.
This type of analysis is just the beginning: There are infinite interesting things you can do with Landsat data and images. Stay tuned for more details in the next post in the Remote Sensing series!