Getting Started with RStudio, Part 2
This post is one of a series of posts on Open Source.
Aug 6, 2018
This article is part 2 of a series exploring the basics of importing and analyzing data in RStudio.
In a previous post we introduced the R programming language, RStudio as a development environment, and examined rainfall data for May. The data we analyzed was stored in Google Docs. We used some functions to pull the data into our work environment, and displayed the data over time using a line graph. In this post, we’re going to make an improvement to this analysis. Specifically, we’re going to streamline the way we access weather data.

Using Data APIs
Arguably, the most critical step to analyzing data is getting data! To conduct analysis in our previous post, I found some data online, manually entered it into a spreadsheet in Google Docs, and then used R to access the data for analysis. This is a useful method to understand, as sometimes a doc can be a quick and simple way to store and manage data. But is this really practical for our use case? Probably not. That’s actually quite inefficient!
Weather data is collected by many organizations around the world, and there are a handful of useful ways to access it. One of the most common ways to access data collected and managed by someone else is through something called an application programming interface (API). APIs actually do many things, offering a whole host of services to developers, but in this case, we’re going to use an API that serves data.
The Power of Libraries
To access this API, we’re going to use a library, or package, similar to the one we used to access Google Sheets. If you review the last post, you’ll remember the point at which we “installed” something using the command “Install.packages()”. In this case, we’re going to install a library called “RWunderground,” a way to connect your RStudio environment to the Weather Underground data.
Install.packages(“rwunderground”)
Now that you have this installed, let’s look at the documentation. Looking through the documentation we can see that, using R, we can collect a lot of data! Let’s keep things simple, and collect weather data for the past week.
WashingtonDC <- set_location(zip_code = 20036)
Week <- history_range(WashingtonDC, date_start = “20180730”, date_end = “20180806”)
Before we move forward, let’s look at this code. The weather API first asked us to define a location, so we defined a variable called “WashingtonDC” using the “set_location()” function. Then we created a new variable called “Week,” and asked the API to send us data from a seven-day range, starting on July 30 and ending on August 6.
This works, but there’s one slight problem. Every time we run this function, it will show us the same week time span. What if we wanted to create a function that ALWAYS shows us the past week? To do that, we need to create two new variables: 1) today, and 2) seven days ago.
Today <- sys.date
LastWeek <- sys.date() – 6
The code above uses the “sys.date” command in R, which returns today’s date, to create a variable called “Today.” Then we created a variable called “LastWeek” using the same command, minus six days. Now we can re-write our “Week” function to include these new variables. Let’s rewrite our API call and run it.
Week <- history_range(WashingtonDC, date_start = LastWeek, date_end = Today)
Much Better! Notice how we replaced the start and end dates with our new variables? Now we can take a look at our data.
Week
Wrapping Up
Voila! We now have a dataframe with seven days’ worth of weather data broken down by the hour! Now we can create graphs that update on their own, showing the last weeks’ worth of weather. Let’s use the same plot function we used in the last post and see how much rain Washington, D.C., has experienced over the past week.
plot(Week$precip, x = Week$date, xlab = “Date”, ylab = “Rainfall/hour (Inches)”, type = “l”, main = “Rainfall in Washington DC”, col = “Blue”)
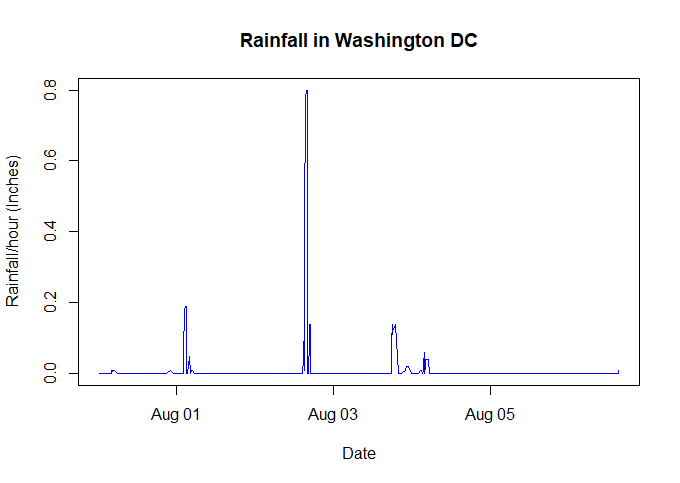
If you compare this graph to the one we made last time, you may notice a few differences. We’ve improved our titles, and added some color.
What we’ve done is some nice descriptive analysis. Now that you know how to access historical weather data, how would you compare total rainfall this month to last month, or even last year? Maybe give it a try!