Testing Data Collection with OpenDataKit
This post is one of a series of posts on Open Source.
Oct 10, 2017
Primary data collection: One of the most challenging, but necessary, components of any research project. Mobile and browser-based technologies have revolutionized the speed and efficiency of collecting data, enabling teams to work together on a centralized database without the headache of managing paper forms, or multiple excel documents.
If you’re reading this article, it’s likely you’ve used Googleforms or Survey Monkey for your work. But what if you need to collect data in regions without 3G or LTE coverage? You’ll need a tool to manage offline data collection, and load the data once you access a wireless internet connection. Fortunately, there are several tools designed to do just that, and one of them is completely free and open source. It’s called OpenDataKit (ODK). Let’s take a look at how this technology works.
Getting Started with ODK
I’m almost embarrassed to admit not having used ODK prior to writing this piece. I have, however, heard mixed reviews of the application. Anecdotally, I’ve heard it is a challenge to set up, the interface is hard to work with, and it lacks strong data visualization tools. But was any of this true?
The introductory video to ODK lays out a set of tools designed to collect, aggregate, and author forms for collecting data. The toolkit is designed to run on a server of your choice, and thorough tutorials for setting up each are available via the website’s documentation. The ODK team also highlights tight integration with Google fusion tables, Google earth, and Google maps. No surprise as ODK was largely funded by a Google Focused Research Award in 2010.
Booting up ODK for the first time, I decided to follow the recommended steps of hosting an instance of Aggregate, the central database for your survey responses, on the Google App Engine. Instructions for hosting a server on AWS, Azure, or your local machine are available should you prefer to go that route. I had an instance of Aggregate up and running in a little under and hour, though the process shouldn’t take more than 10 minutes next time. While I found this to be a fairly routine process, I can see how this first step may intimidate users less comfortable with server management. I should also say that the Aggregate interface looks dated relative to Google forms or Fulcrum, but that’s not a deal breaker if the technology functions well.
Designing a Survey
The next step was building a survey. The documentation walks new users through two primary mechanisms for survey building. The first is a drag-and-drop application called Build, which provides most survey tools, including open-ended and multiple choice question formats, GPS integration for geotagging, and the ability to take photos or scan barcodes. The second is a tool called XLSForm, which is designed to convert excel tables into a form. Build strikes me as much more intuitive than XLSForm, though I can see instances where multiple people already comfortable with the technology may want to collaborate on the design of an extensive survey, or want to administer a copy of the same survey in multiple collections without rebuilding the question set every time. In these cases, complex questions and responses are best managed in a shared excel file.
So, what about the mobile app? If you want to administer surveys across a large team, the app needs to be easy to use, and must accomplish the task of hosting data on a local offline device before pushing data to the central server. ODK’s mobile tool is called Collect, and is designed for Android devices. There appears to be no simple solution for iPhone users, though the ODK site does reference a paid solution called iFormBuilder.
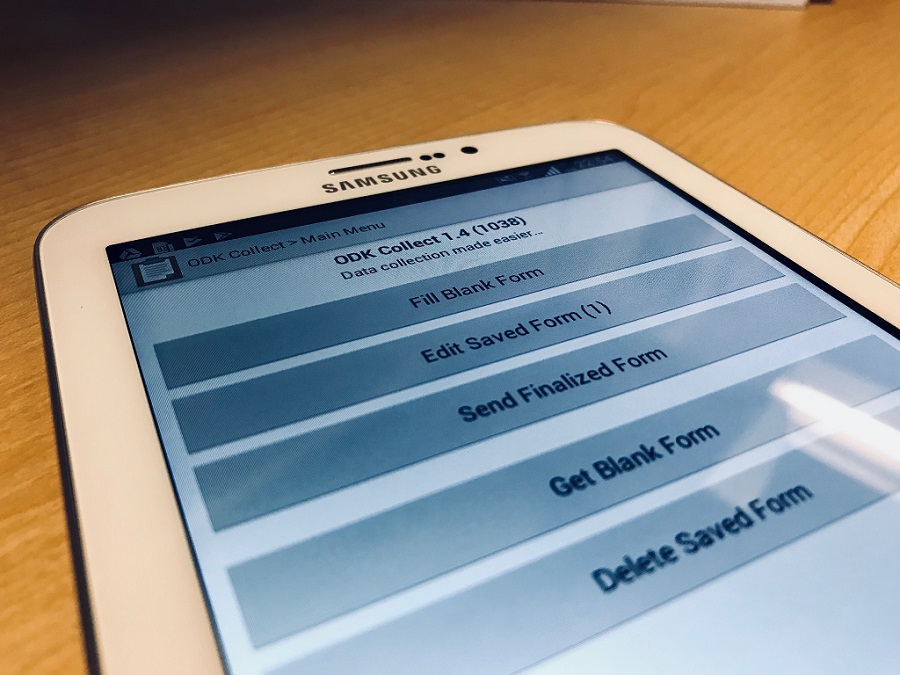
I easily installed Collect via GooglePlay, logged into my Google Apps server, and could seamlessly access my forms. The mobile interface also looks a bit dated, but everything worked as promised. Offline form responses were hosted on the tablet until I turned the Wifi back on, which pushed survey responses to the online database. So far so good.
Analyzing and Visualizing Data
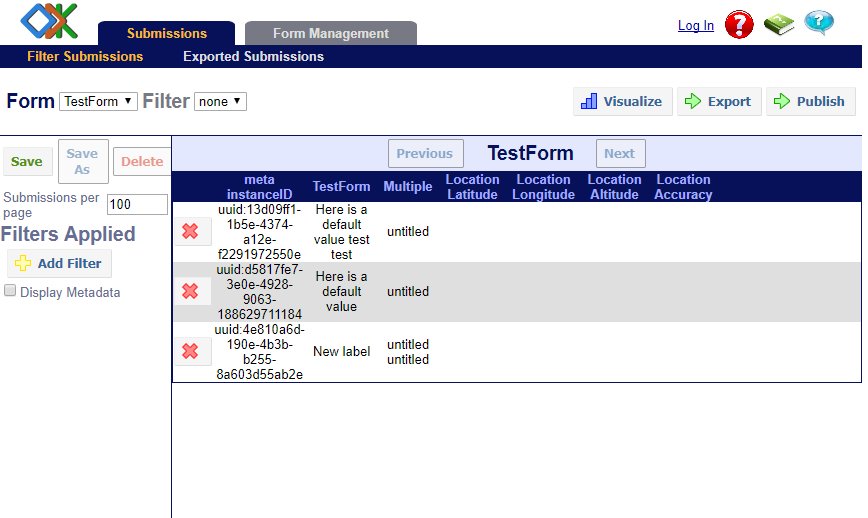
Thinking back to the original criticisms of the application—I’ve found getting started with ODK to be straightforward, and the interface to be slightly dated, but what about the third criticism about poor data visualization and analytics? ODK provides the option of displaying data in bar charts, pie charts, or maps. And that’s about it at this point. The good news is that you can export your data in a variety of formats, or host it for access by other applications. This includes publishing a live feed of JSON, connecting to a REDcap server, or connecting directly with your GoogleSheets or FusionsTables. While this limitation may be seen as a gap to some, others will be happy to analyze and visualize data in a dedicated business intelligence application such as PowerBI or Tableau, or to develop custom applications in their programming language of choice.
Conclusions
So, would we use ODK at DAI? Absolutely. What the OpenDataKit developers have created is a free technology for offline data collection that can be synched across multiple users, and that is extensible to other technologies. If your organization already has access to dedicated survey collection tools such as Fulcrum, or integrated collection tools such as Esri’s Geoforms, then it may make more sense to leverage the more advanced technology, or stay tightly integrated with your existing analysis applications. But if you’re working on a limited budget, or simply like getting your hands on technology that you can customize to your liking, each shortcoming of the ODK toolkit can be overcome with patience and creativity, and should be another free tool in the quiver of open source technology enthusiasts. I have a feeling our ICT team will implement an ODK collection in the near future. I’m just sad I hadn’t tried to use this set of tools sooner.
For more information about ODK, please visit their website.