Data Mining and the Human Development Index
Mar 9, 2016

We love data mining at DAI and today we are going to mine a data set from the United Nations (UN). We are going to do so by first working through an illustrative four-wheeled example.
The Human Development Index (HDI)
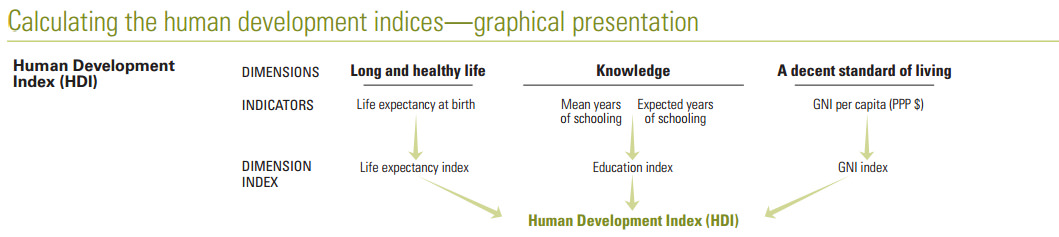
The UN maintains an index for 188 countries describing the overall level of human development of each country based on three pillars: health, education, and standard of living. Specifically, the HDI dataset is based on:
- Gross national income
- Life expectancy at birth
- Expected years of schooling
- Mean years of schooling
Each country is indexed on those variables for every year from 1980 to 2014. The result of the index calculation is a single value, the HDI, describing the overall strength of human development. It’s a measurable data point on which to gauge progress over time and it helps focus aid in countries and sectors that need it most.
| UN Classification | HDI |
|---|---|
| Very high human development | 0.800 and above |
| High human development | 0.700–0.799 |
| Medium human development | 0.550–0.699 |
| Low human development | Below 0.550 |
For an example of what the data looks like, here are the dimensions of the HDI for Ghana (GHA) and Haiti (HTI), with Ghana in the medium development class and Haiti in the low development class.
| Country | Gross national income | Life expectancy | Expected years schooling | Mean years schooling | HDI |
|---|---|---|---|---|---|
| GHA | 3852 | 61.4 | 11.5 | 7 | 0.58 |
| HTI | 1668.71 | 62.8 | 8.67 | 4.895 | 0.48 |
Comparing dimensions and HDI values for two countries is straightforward, but attempting to glean deeper insight from the full set of 188 countries would be difficult. One option is to simply sort the data by the HDI to show highly developed countries at the top and countries with low development at the bottom.
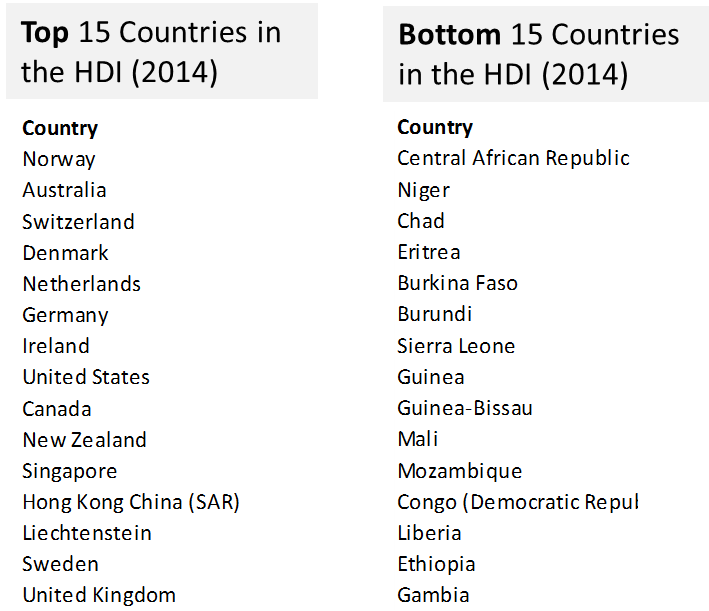
Ranking by HDI helps identify the countries with the lowest and highest levels of development, but it also obscures some nuances in the data. Using data mining and visualization we can improve our understanding of the data and learn how the countries are distributed according to the index.
Data Mining for Similarity
Starting with a small data set, let’s put four car models into our dendrogram to see how they cluster by height and weight. We’ll look the Fiat 500, Mini Cooper, Hummer H3, and Cadillac Escalade

| Vehicle | Height | Weight |
|---|---|---|
| hummer h3 | 73.2 | 4883 |
| escalade | 74.4 | 5915 |
| fiat 500 | 59.8 | 2512 |
| Mini cooper | 56.1 | 2545 |
Using just a few lines of code from a programming environment called R, we can process the table and create our cluster diagram
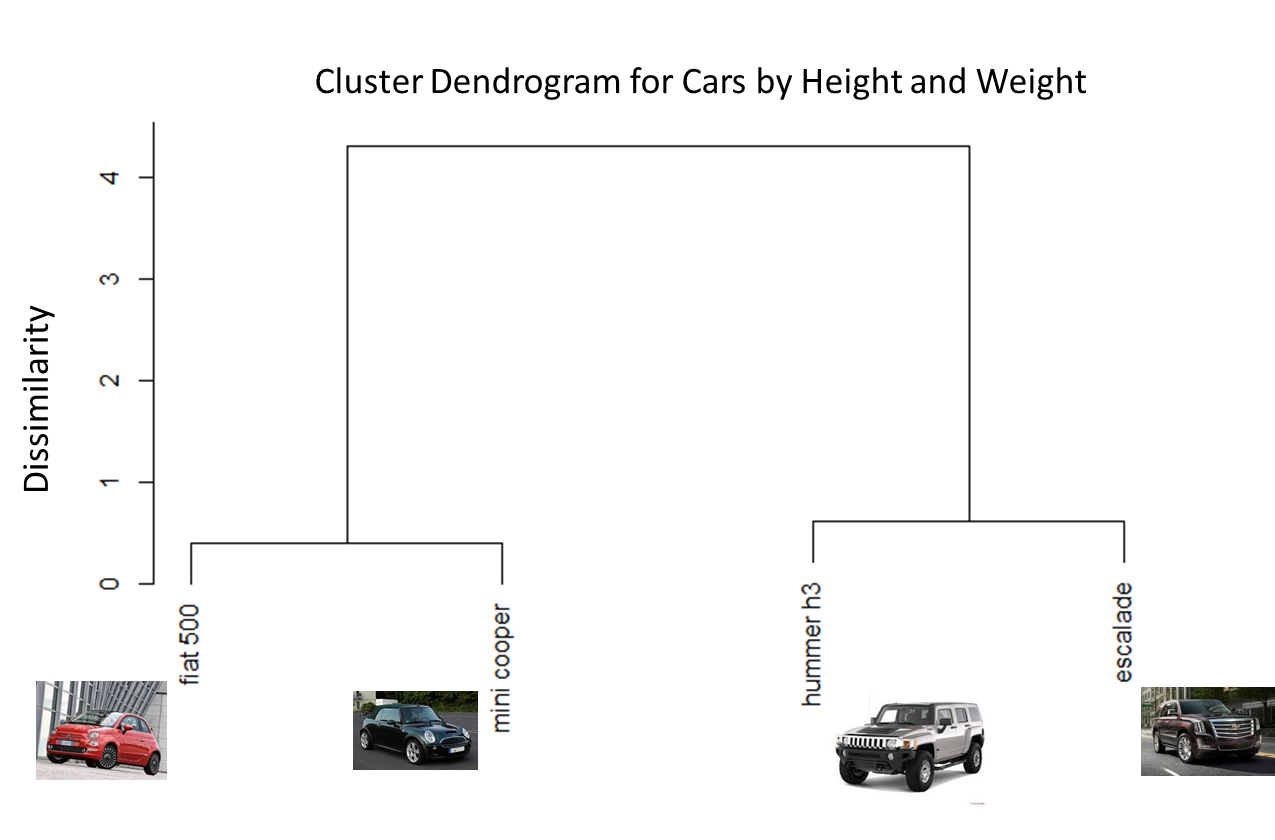
The diagram clearly groups the data into two classes, big and tall cars (Hummer and Escalade) into one cluster and small cars (Fiat and Mini Cooper) into another cluster. It is not surprising that the big cars form one cluster and the small cars are in another cluster. The height of the horizontal bar separating the clusters describes the degree of dissimilarity between them.
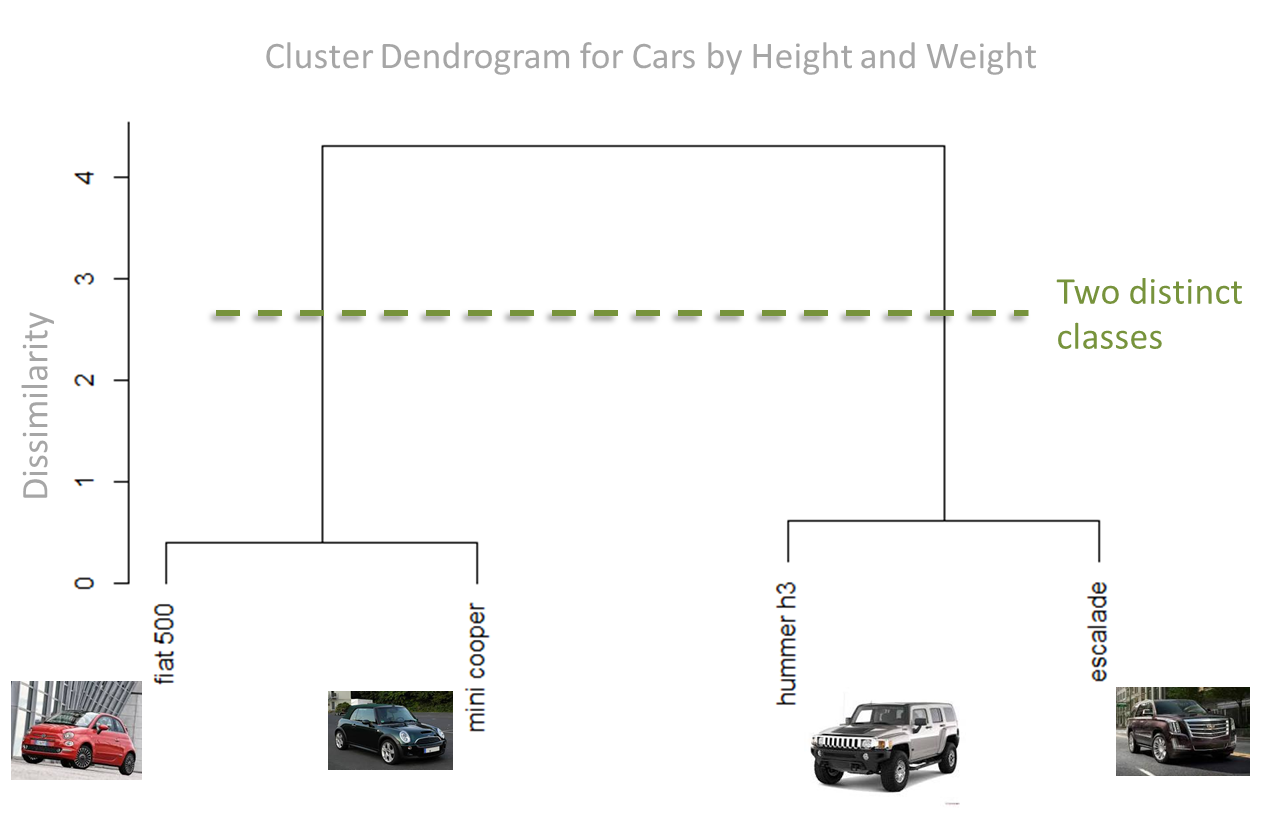
The most important job of the dendrogram is to identify classes and to show which data elements belong in each class. In the following image we show a line indicating the identification of two distinct classes identified by the dendrogram
A Dendrogram for the HDI
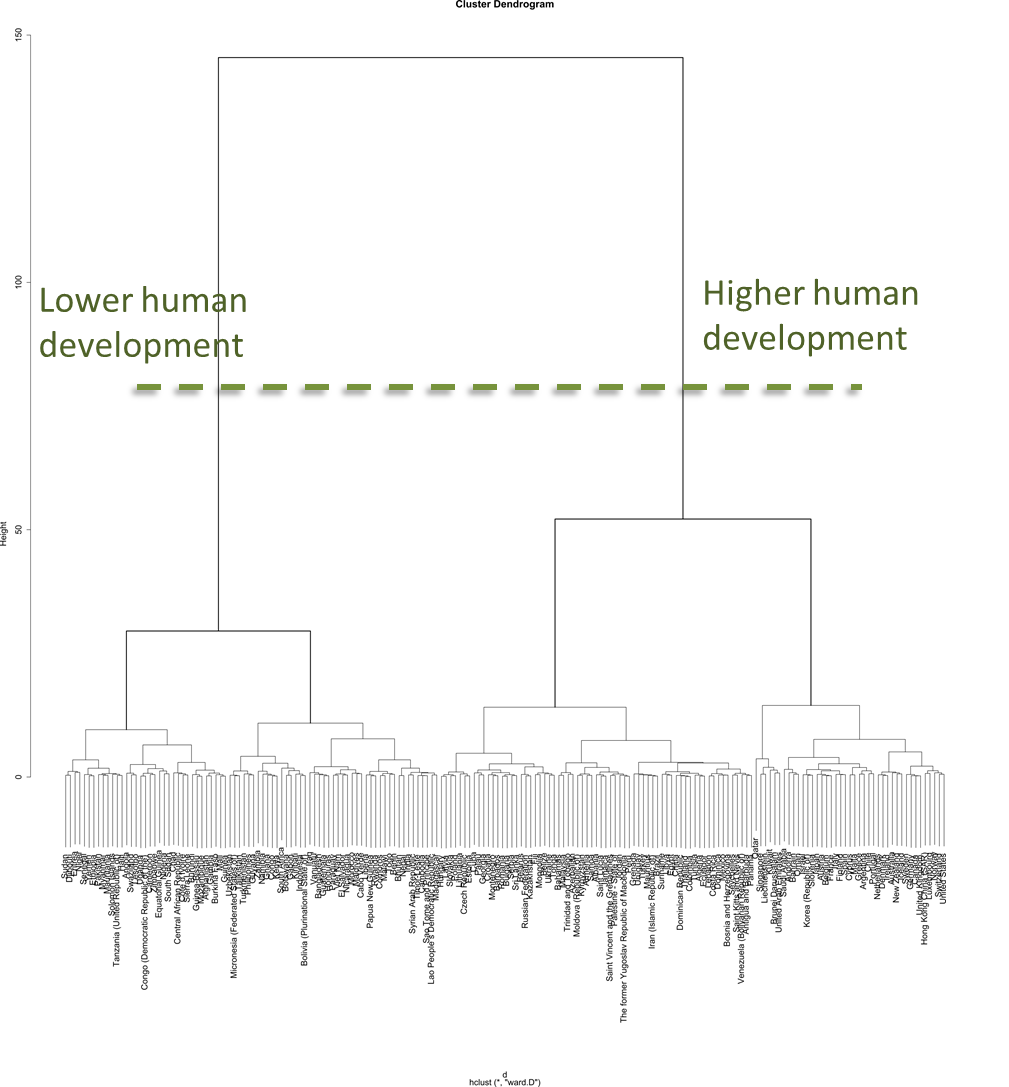
Instead of just looking at two variables, we can use something slightly more complex like the four components in the HDI to cluster countries. Making the plot with nearly the same R script that we used for the car example, we start to see some patterns right away. In our HDI dendrogram, there are clearly two distinct groups, represented by the big tall branches at the root.
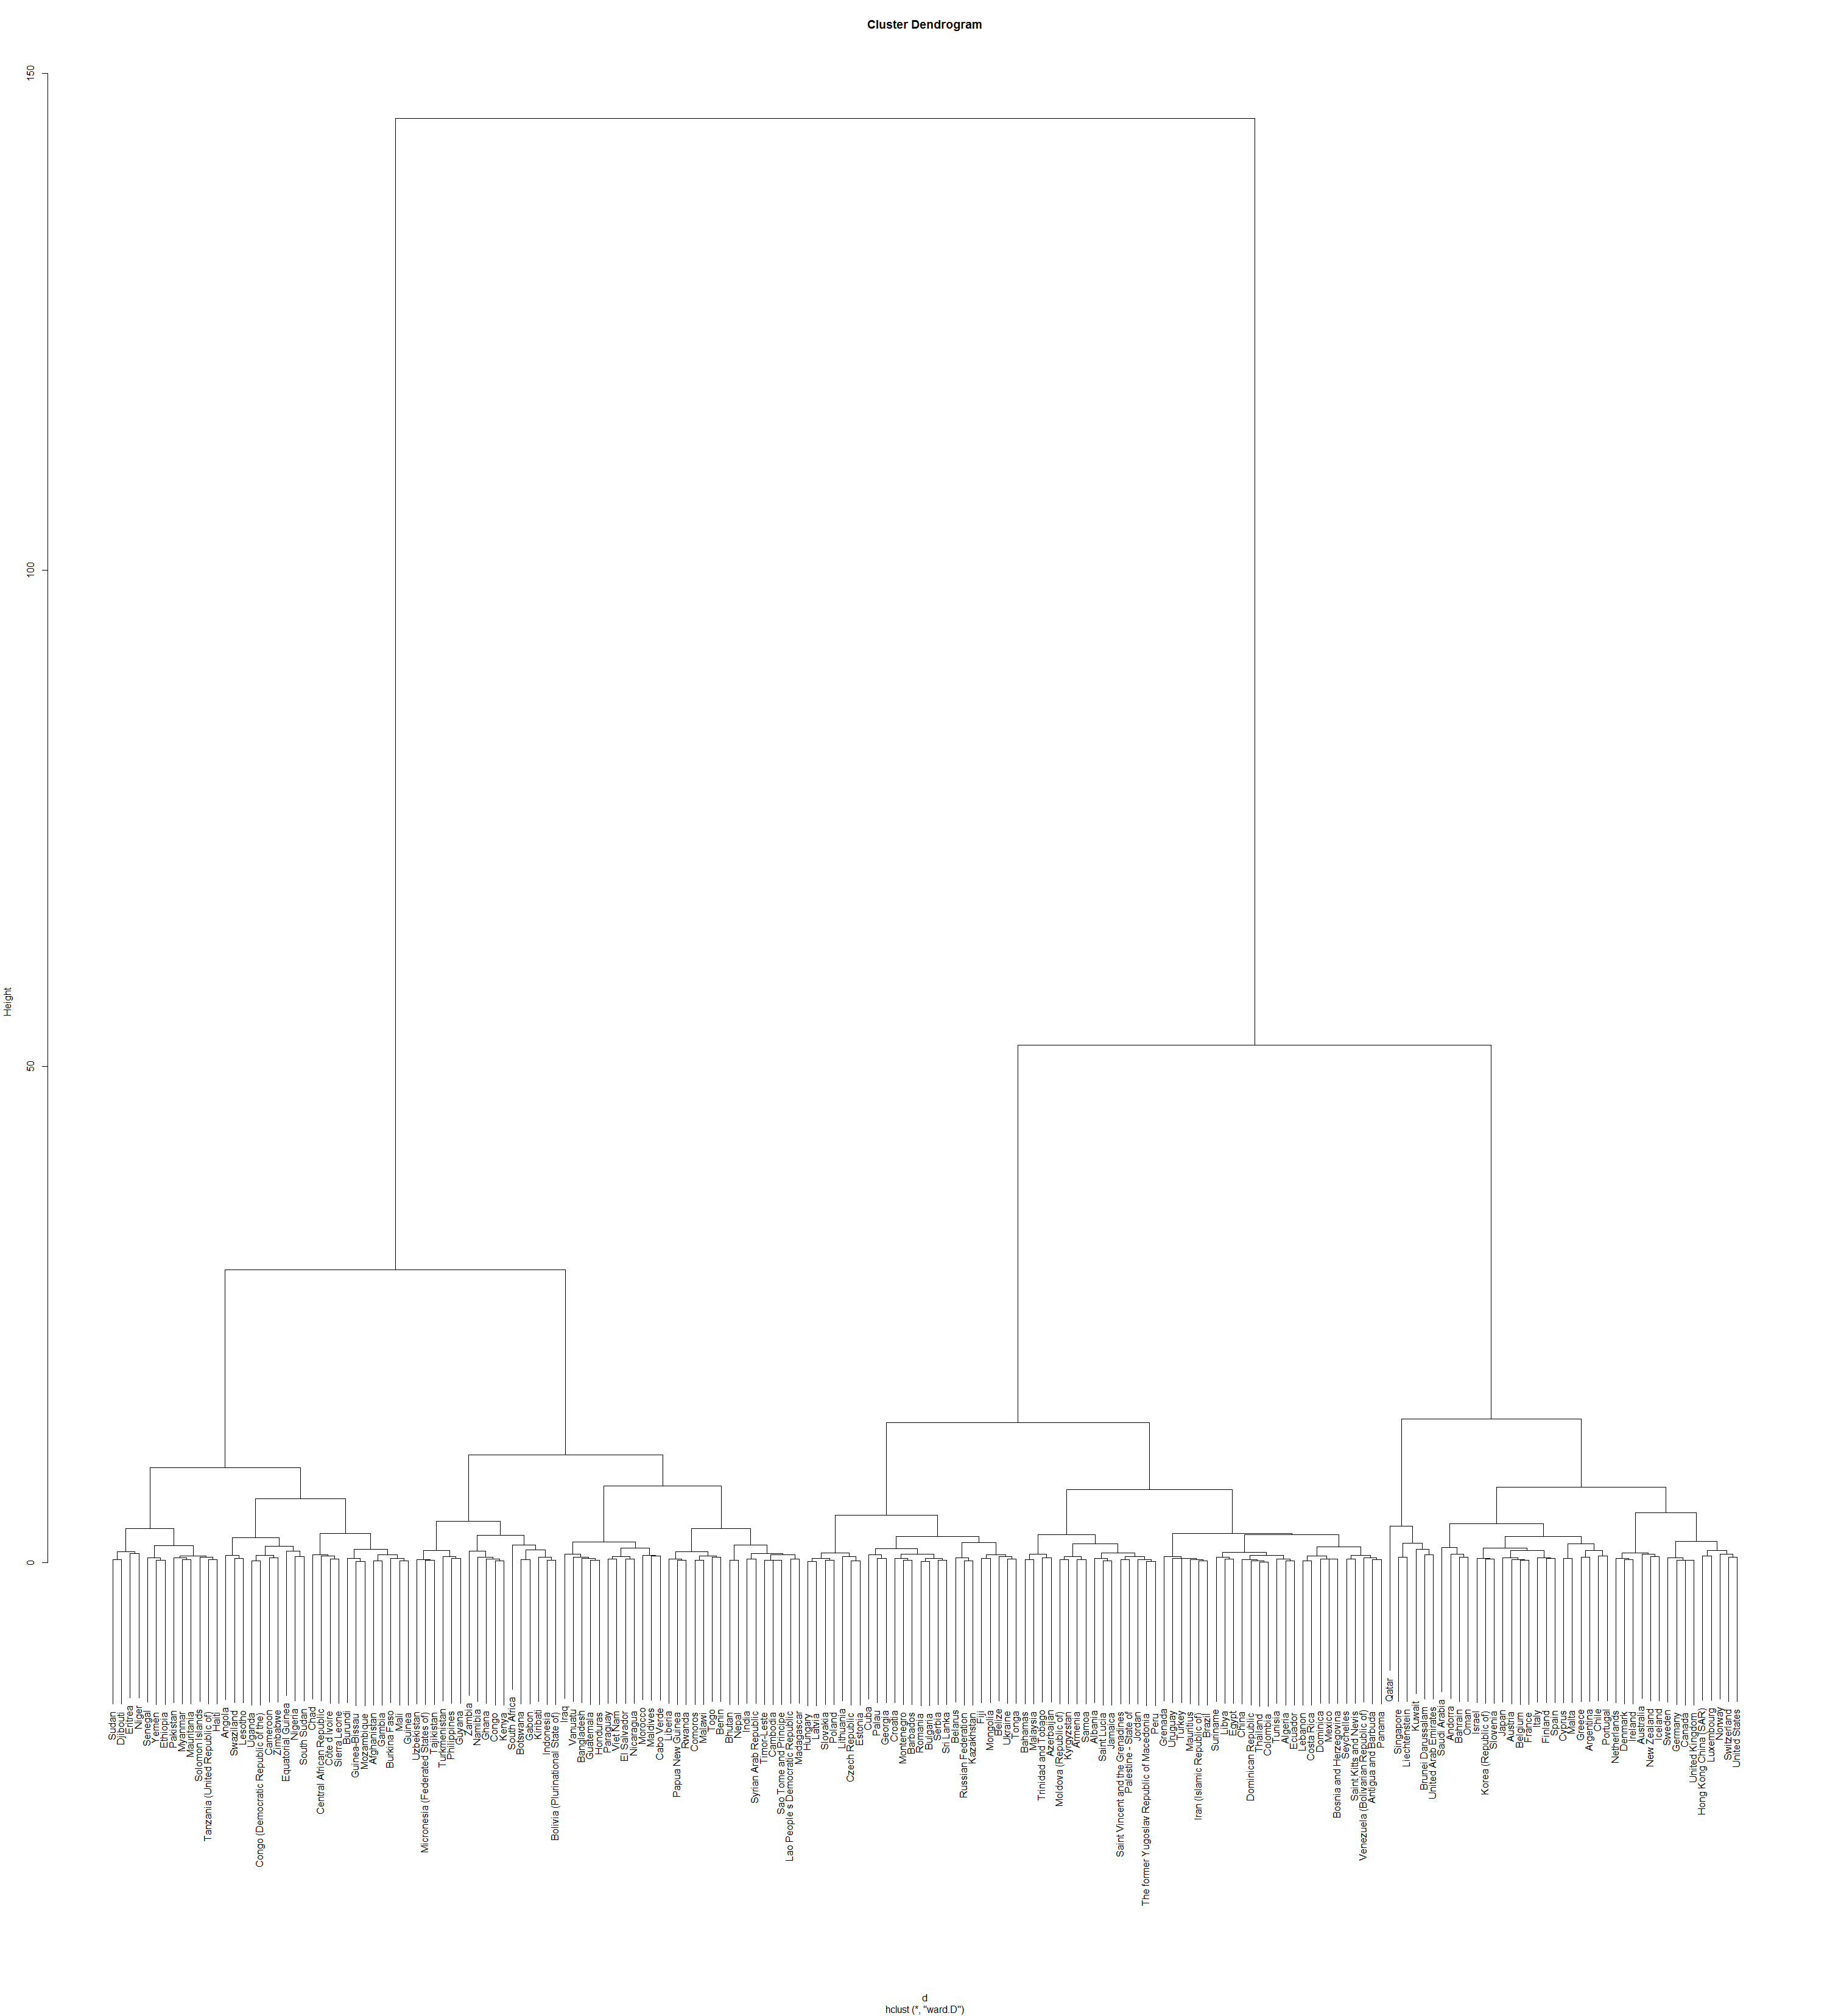
Dendrogram for the Human Development Report. Countries are clustered on 2014 values for: Life expectancy at birth, expected years of schooling, mean years of schooling, and gross national income per capita
It appears that the branch on the left are low development countries and the right branch are the high development countries. The height of the split in relation to the height of the lower clusters means that degree of dissimilarity between the top two classes is much greater than of those lower down in the dendrogram.
This means countries with low development values are far behind the those in the medium and high development.
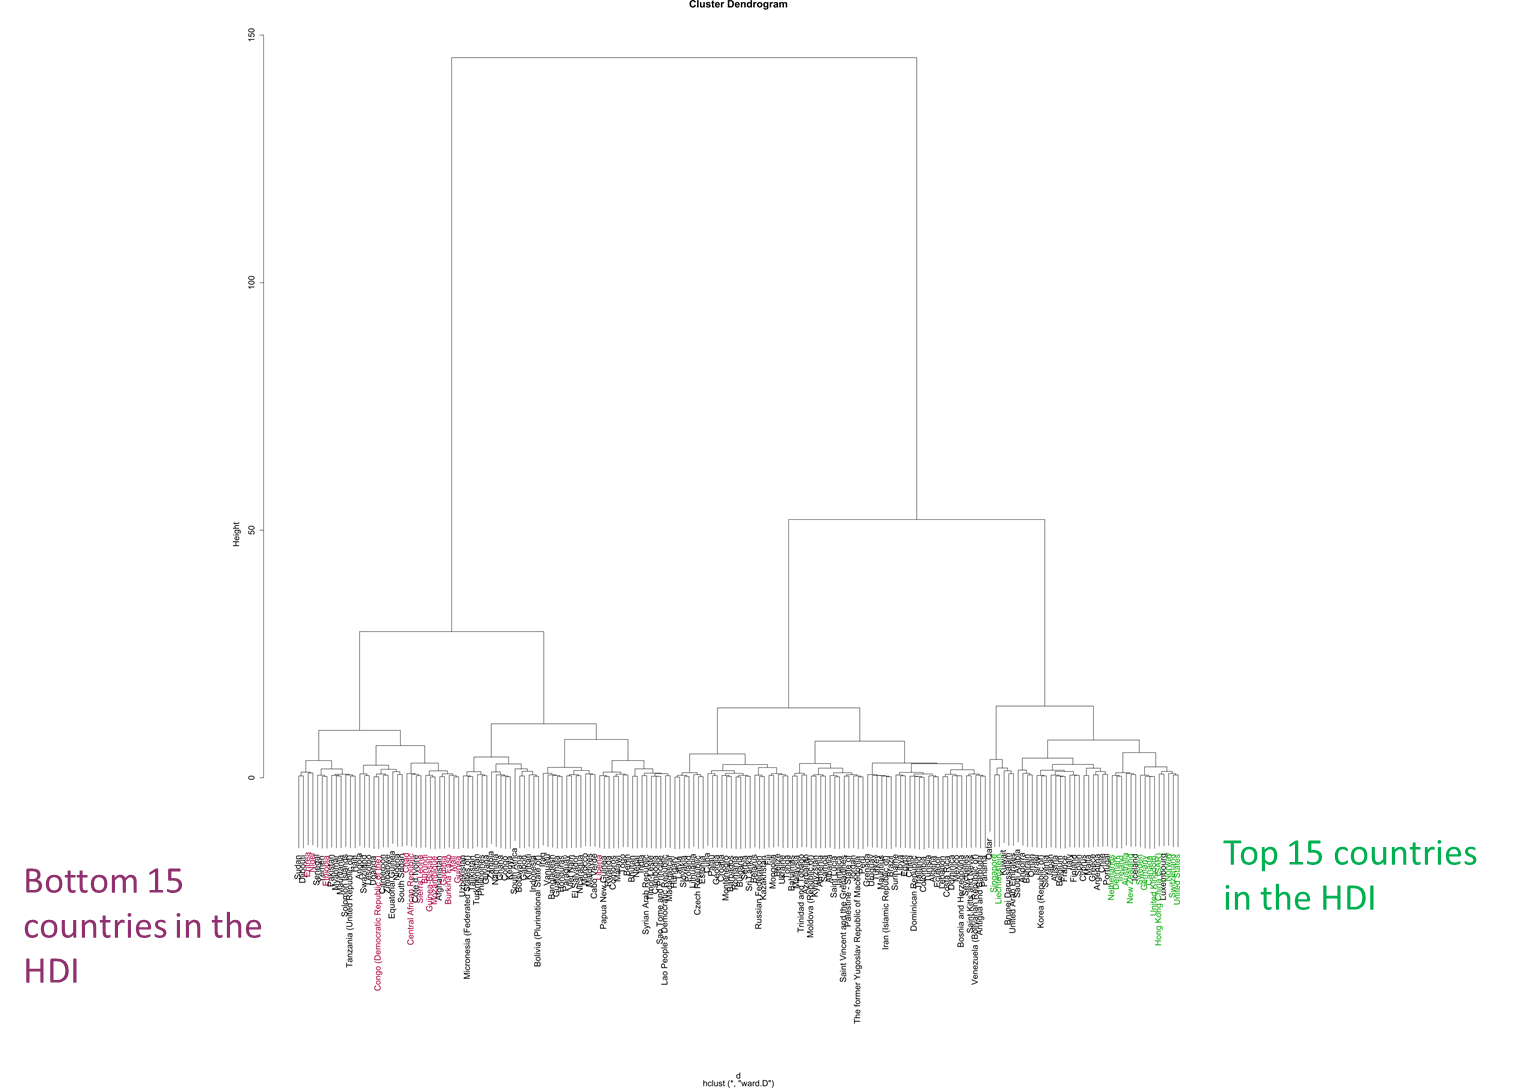
Highlighting the top 15 and bottom 15 countries according to HDI. The non-adjacency occurs because clustering is based on the component variables instead of the HDI
Notice that the top 15 and bottom 15 countries by HDI are not adjacent to one another in tight clusters? That’s because the data is clustered by component variables, not the HDI alone.
Two highly distinct clusters in the dendrogram reveal incredible differences in development
Our dendrogram reveals a massive split between the low development and higher development groups and another sizable split between the high and medium groups at the three-class level.
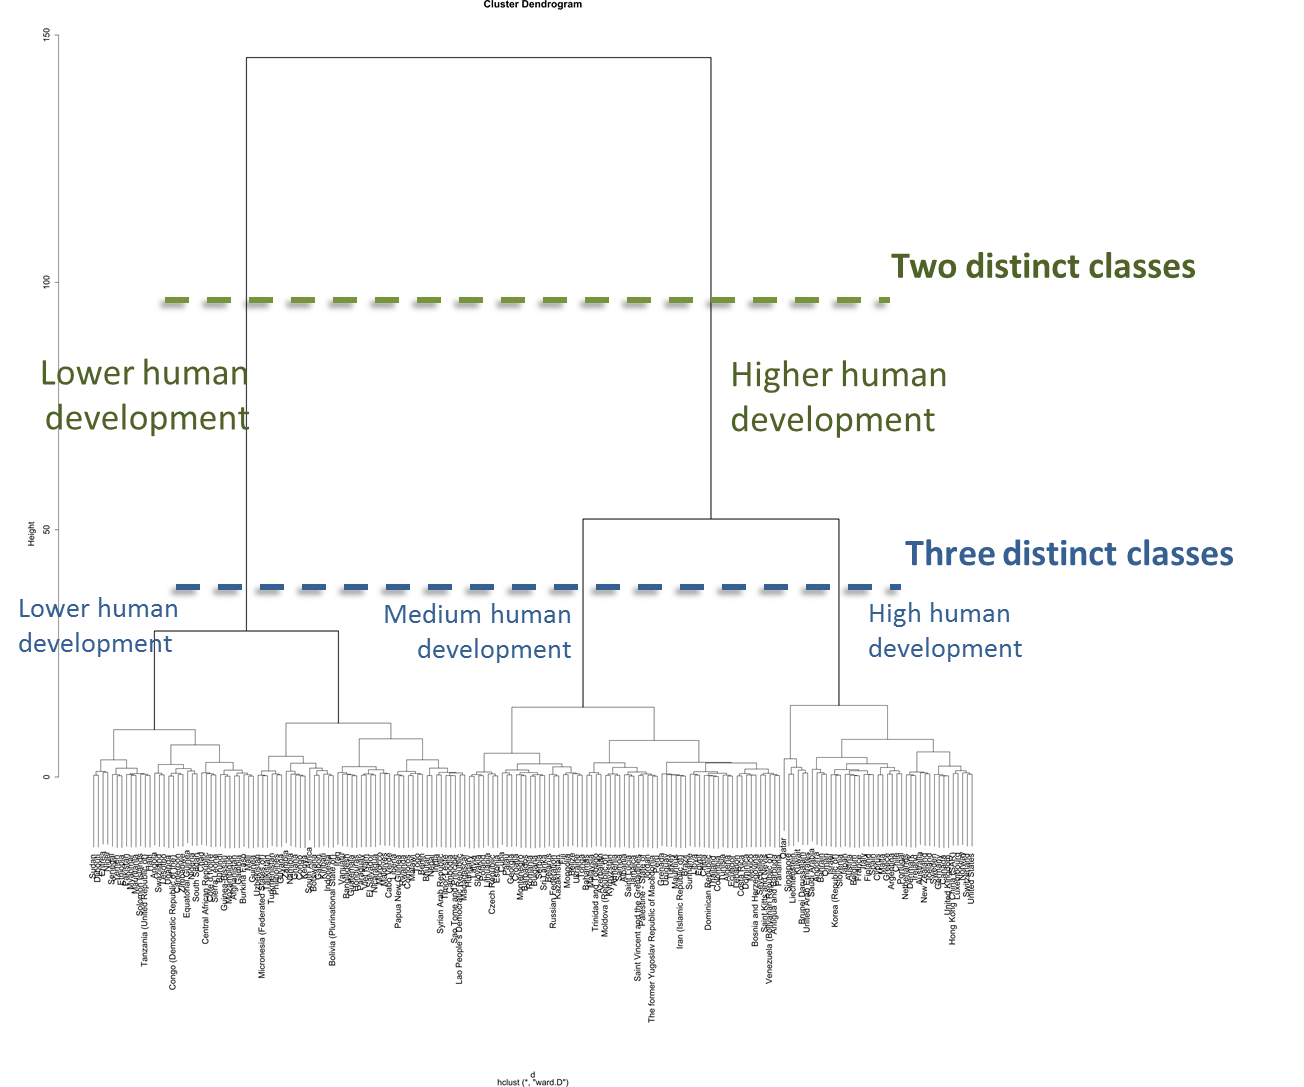
The hierarchy of clusters shows two distinct clusters at the top. Within those two clusters are three clusters. This hierarchy continues down into the dendrogram
Clusters Highlighting Similar Countries
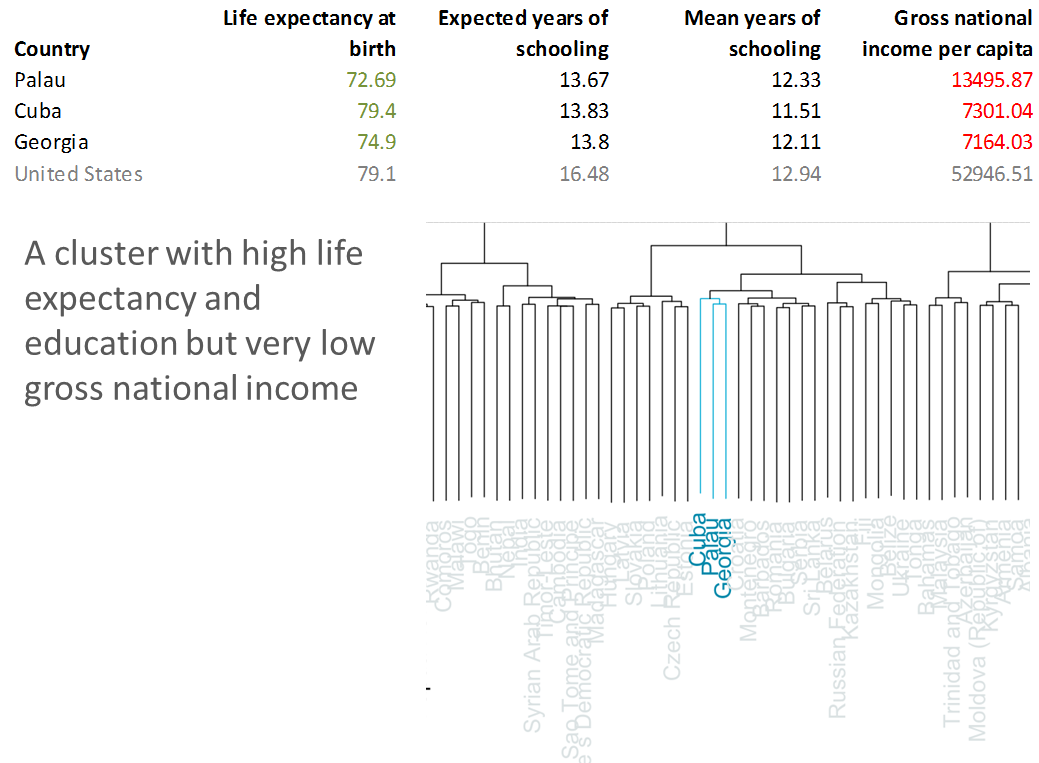
In the dendrogram we see a group of countries located far from each other on the globe but clustered together tightly here in our tree diagram. These countries represent an interesting group that has high life expectancy and education but low gross national income. Perhaps the governments of these countries have done well to prioritize health care systems but are not doing as well economically. These countries are Cuba, Georgia, and the island nation of Palau. Each has a population with a life expectancy above 72, but low gross national income—for comparison it is at least 25 percent of that of the United States.
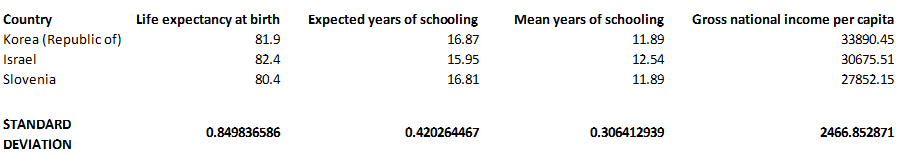
Here’s another tight cluster: Israel, Korea, and Slovenia. Checkout how similar they are! Statistically similar but geographically and culturally distinct—fascinating!
Clustering Applications for Development
There are countless ways clustering data can help us more easily recognize patterns and improve our development practices. If you had a group of farmers outperforming another group for unknown reasons, clustering might show what is similar among the high-performing group. When selecting cities or regions for an intervention, you might want to pick one similar to where an intervention was successful in the past.
You too can do Hierarchical Cluster Analysis
It’s easy, just download the amazing and free statistical programming environment called R
Then with just a few clicks in R, you will be up and running. All the code that you need to do this, all six lines of it, can be found here
The cars script and the HDI script are exactly the same, the only difference is the data source.